
Is It Too Late To Consider CyberArk Software (CYBR) After A Near 3x Three-Year Surge?
- For investors wondering whether CyberArk Software's share price still offers value after a strong run, or if expectations have run ahead of reality, this article focuses squarely on what investors are paying for the business today.
- The stock last closed at US$467.82, with returns of 4.9% over 7 days, a 0.6% decline over 30 days, 7.5% year to date, 35.8% over 1 year and a very large 3-year gain that is close to 3x, as well as 197.1% over 5 years.
- Recent coverage has highlighted CyberArk Software in the context of growing attention on cybersecurity providers and how investors are treating the sector as a whole. This wider focus provides useful context for the share price performance and sets up the question of whether the current level still reflects a reasonable price for the company.
- On Simply Wall St's 6 point valuation checklist, CyberArk Software currently scores 0 out of 6. This raises fair questions about what traditional models are indicating and whether there is a better way to think about value, which we will come back to after reviewing the usual valuation approaches.
CyberArk Software scores just 0/6 on our valuation checks. See what other red flags we found in the full valuation breakdown.
Approach 1: CyberArk Software Discounted Cash Flow (DCF) Analysis
A Discounted Cash Flow, or DCF, model estimates what a company could be worth today by projecting its future cash flows and discounting them back to a present value. It is essentially asking what those future dollars are worth in today's terms.
For CyberArk Software, the model used is a 2 Stage Free Cash Flow to Equity approach based on cash flow projections. The company’s last twelve months Free Cash Flow is about $205.1 million. Analyst inputs and extrapolations then project Free Cash Flow reaching $1,496.2 million in 2030, with a series of annual figures in between that are discounted back to today in the model.
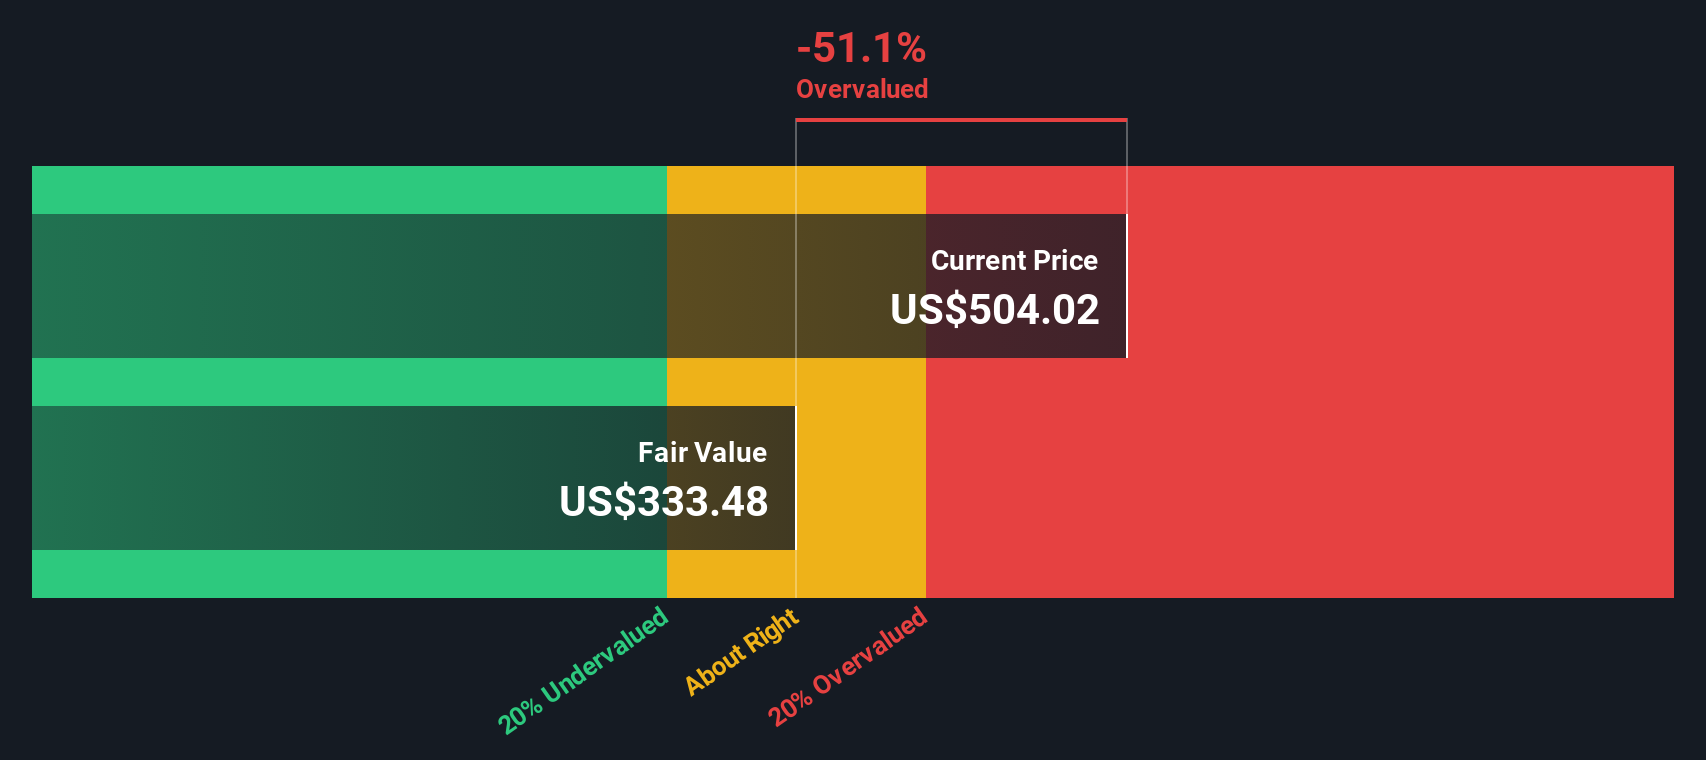
Bringing all of those projected cash flows back to today, Simply Wall St’s DCF setup arrives at an estimated intrinsic value of about $453.86 per share. Against the recent share price of $467.82, that implies CyberArk is about 3.1% overvalued on this model, which is a relatively small gap and well within the kind of margin of error you would expect from any long term forecast.
Result: ABOUT RIGHT
CyberArk Software is fairly valued according to our Discounted Cash Flow (DCF), but this can change at a moment's notice. Track the value in your watchlist or portfolio and be alerted on when to act.
Approach 2: CyberArk Software Price vs Sales
For a company like CyberArk Software that is being evaluated on its revenue base, the P/S ratio is a useful way to see what investors are paying for each dollar of sales, especially when earnings are not the main focus.
Higher growth expectations or lower perceived risk usually justify a higher P/S multiple, while slower growth or higher risk tend to pull a “normal” or “fair” multiple lower. So the key question is whether CyberArk’s current P/S looks reasonable relative to its own characteristics, not just blunt sector averages.
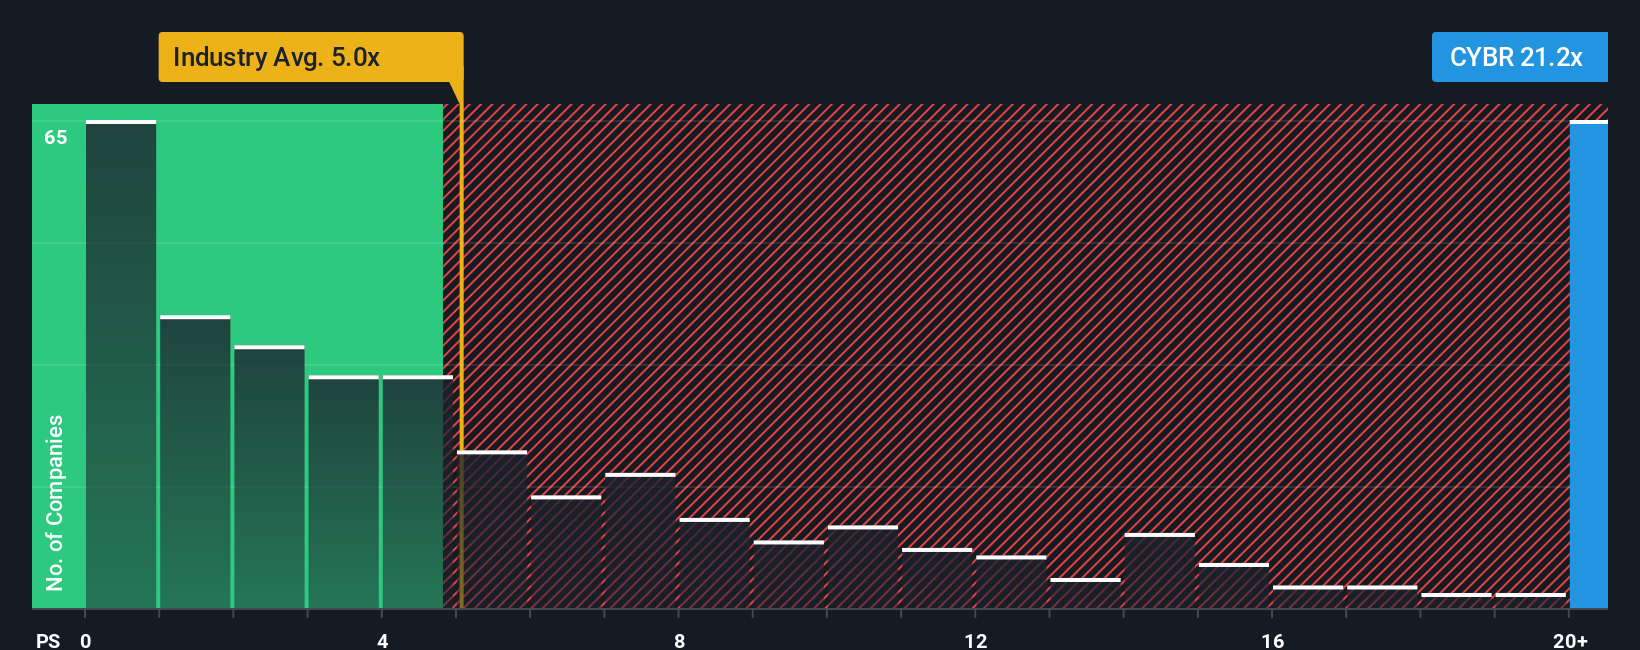
CyberArk is currently trading on a P/S of 18.12x, compared with the Software industry average of 4.91x and a peer group average of 9.26x. Simply Wall St’s proprietary Fair Ratio for CyberArk is 8.88x, which reflects factors such as its growth profile, profit margins, industry, market cap and risk characteristics. This Fair Ratio can be more informative than a simple peer or industry comparison because it tries to tailor the “expected” multiple to the company’s own fundamentals rather than relying on broad benchmarks.
Comparing the current 18.12x P/S to the 8.88x Fair Ratio suggests CyberArk’s shares are pricing in a premium relative to what this model views as a more typical level.
Result: OVERVALUED
P/S ratios tell one story, but what if the real opportunity lies elsewhere? Discover 1443 companies where insiders are betting big on explosive growth.
Upgrade Your Decision Making: Choose your CyberArk Software Narrative
Earlier we mentioned that there is an even better way to understand valuation. On Simply Wall St’s Community page you can use Narratives, where you or other investors link a company’s story to specific forecasts for revenue, earnings and margins, translate that into a fair value, and then compare it with the current price. Each Narrative updates automatically when new news or earnings arrive. For CyberArk you might see one investor building a thesis around a fair value close to the higher end of recent targets near US$551 and another closer to the lower end around US$415. You can then quickly see which story and implied fair value you feel most comfortable using to guide your own decisions.
Do you think there's more to the story for CyberArk Software? Head over to our Community to see what others are saying!

This article by Simply Wall St is general in nature. We provide commentary based on historical data and analyst forecasts only using an unbiased methodology and our articles are not intended to be financial advice. It does not constitute a recommendation to buy or sell any stock, and does not take account of your objectives, or your financial situation. We aim to bring you long-term focused analysis driven by fundamental data. Note that our analysis may not factor in the latest price-sensitive company announcements or qualitative material. Simply Wall St has no position in any stocks mentioned.
Have feedback on this article? Concerned about the content? Get in touch with us directly. Alternatively, email editorial-team@simplywallst.com