
Is It Too Late To Consider Lam Research (LRCX) After Its Recent Share Price Surge
- If you are wondering whether Lam Research shares still offer value after a strong run, or if most of the good news is already reflected in the price, this article unpacks that question in plain terms.
- Over the last week the stock logged an 18.6% return, with 22.5% over the past month, 9.7% year to date, 166.0% over 1 year and 345.8% over 3 years. These moves naturally raise questions about growth potential and changing risk perceptions.
- Recent coverage around Lam Research has focused on its role within the broader semiconductor supply chain and how investors are reacting to that positioning, especially as chip related headlines stay in the spotlight. These themes provide useful context for understanding why the share price has attracted so much attention from the market.
- Despite that context, Lam Research currently records a valuation score of 1 out of 6. We will look at how different valuation methods interpret that result, then finish by discussing a more complete way to think about valuation beyond the usual ratios.
Lam Research scores just 1/6 on our valuation checks. See what other red flags we found in the full valuation breakdown.
Approach 1: Lam Research Discounted Cash Flow (DCF) Analysis
A DCF model takes estimates of a company’s future cash flows, then discounts them back to today’s dollars to arrive at an estimated intrinsic value per share.
For Lam Research, the model uses last twelve months Free Cash Flow of about $5.73b and projects future Free Cash Flow out to 2035 using a 2 Stage Free Cash Flow to Equity approach. Analyst inputs feed projections through 2030, such as an estimated $7.84b in Free Cash Flow for 2030, and Simply Wall St extrapolates further figures from there.
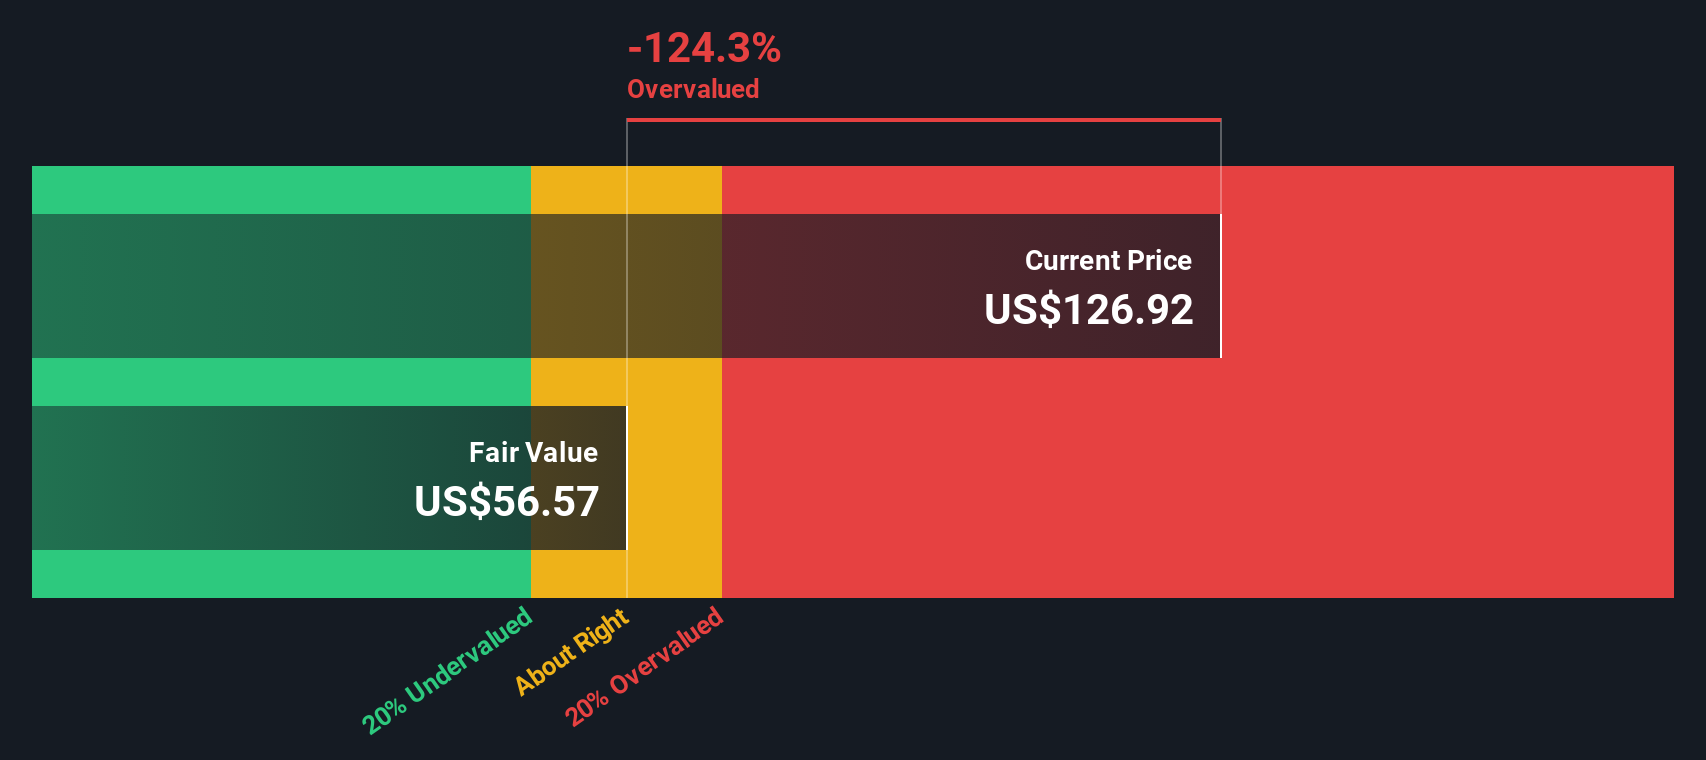
When those projected cash flows are discounted back to today and divided by the number of shares, the model arrives at an estimated intrinsic value of $66.29 per share. Compared to the current share price, this implies an intrinsic discount of 206.4%, which, on this set of assumptions, indicates that the stock screens as heavily overvalued rather than close to fair value.
Result: OVERVALUED
Our Discounted Cash Flow (DCF) analysis suggests Lam Research may be overvalued by 206.4%. Discover 886 undervalued stocks or create your own screener to find better value opportunities.
Approach 2: Lam Research Price vs Earnings
For a profitable company like Lam Research, the P/E ratio is a useful way to gauge what investors are currently willing to pay for each dollar of earnings. It captures, in one number, how the market is weighing the company’s earnings power against alternatives.
What counts as a “normal” or “fair” P/E usually reflects a mix of growth expectations and perceived risk. Higher expected earnings growth or lower perceived risk can support a higher multiple, while slower growth or higher risk typically point to a lower one.
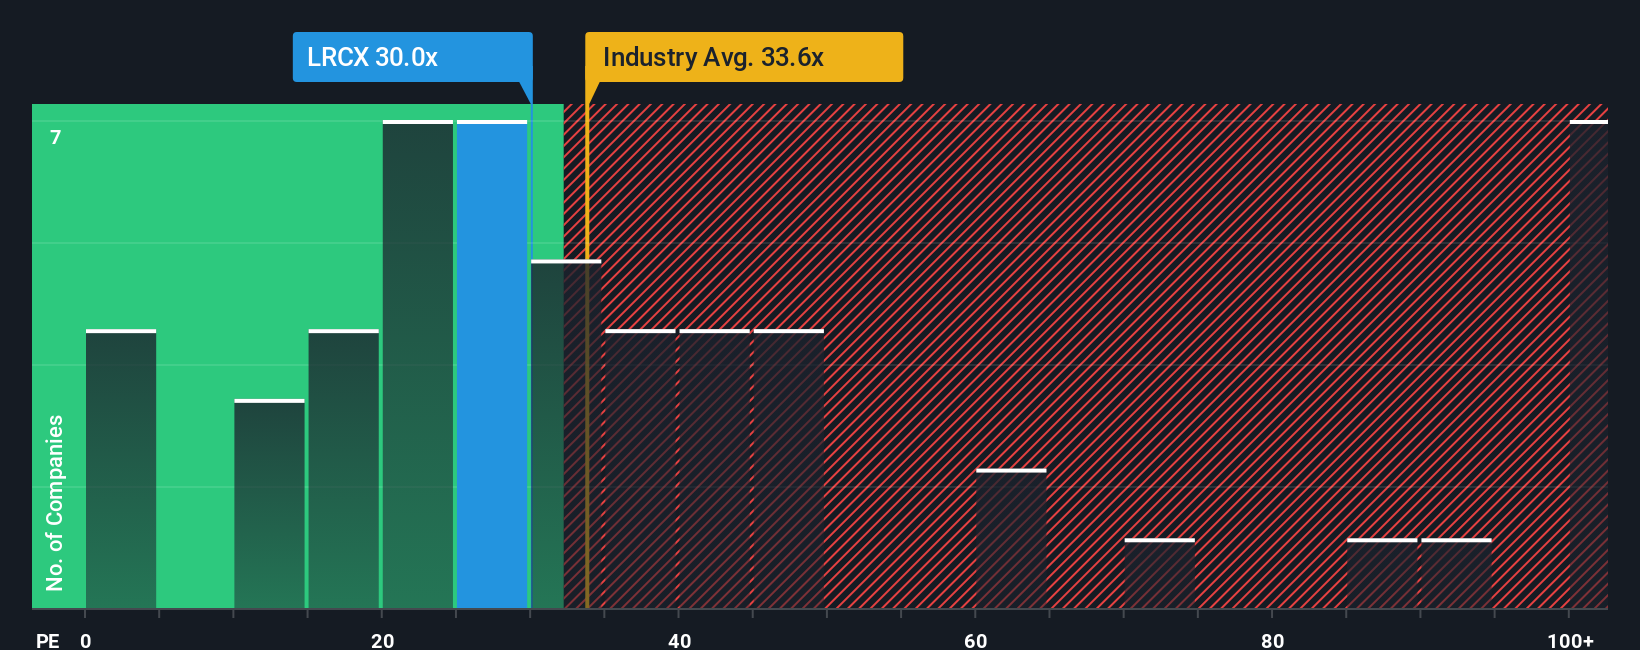
Lam Research currently trades on a P/E of 43.9x. That sits close to the Semiconductor industry average P/E of 42.3x and the peer group average of 44.4x. Simply Wall St also calculates a “Fair Ratio” of 33.9x, which is the P/E it would expect given factors such as Lam Research’s earnings growth profile, profit margins, industry, market value and company specific risks.
This Fair Ratio can be more informative than a simple comparison with peers or the broad industry because it folds in those company specific characteristics rather than treating all semiconductor names as identical. Since the current P/E of 43.9x is well above the Fair Ratio of 33.9x, this approach points to the shares looking expensive on earnings.
Result: OVERVALUED
P/E ratios tell one story, but what if the real opportunity lies elsewhere? Discover 1443 companies where insiders are betting big on explosive growth.
Upgrade Your Decision Making: Choose your Lam Research Narrative
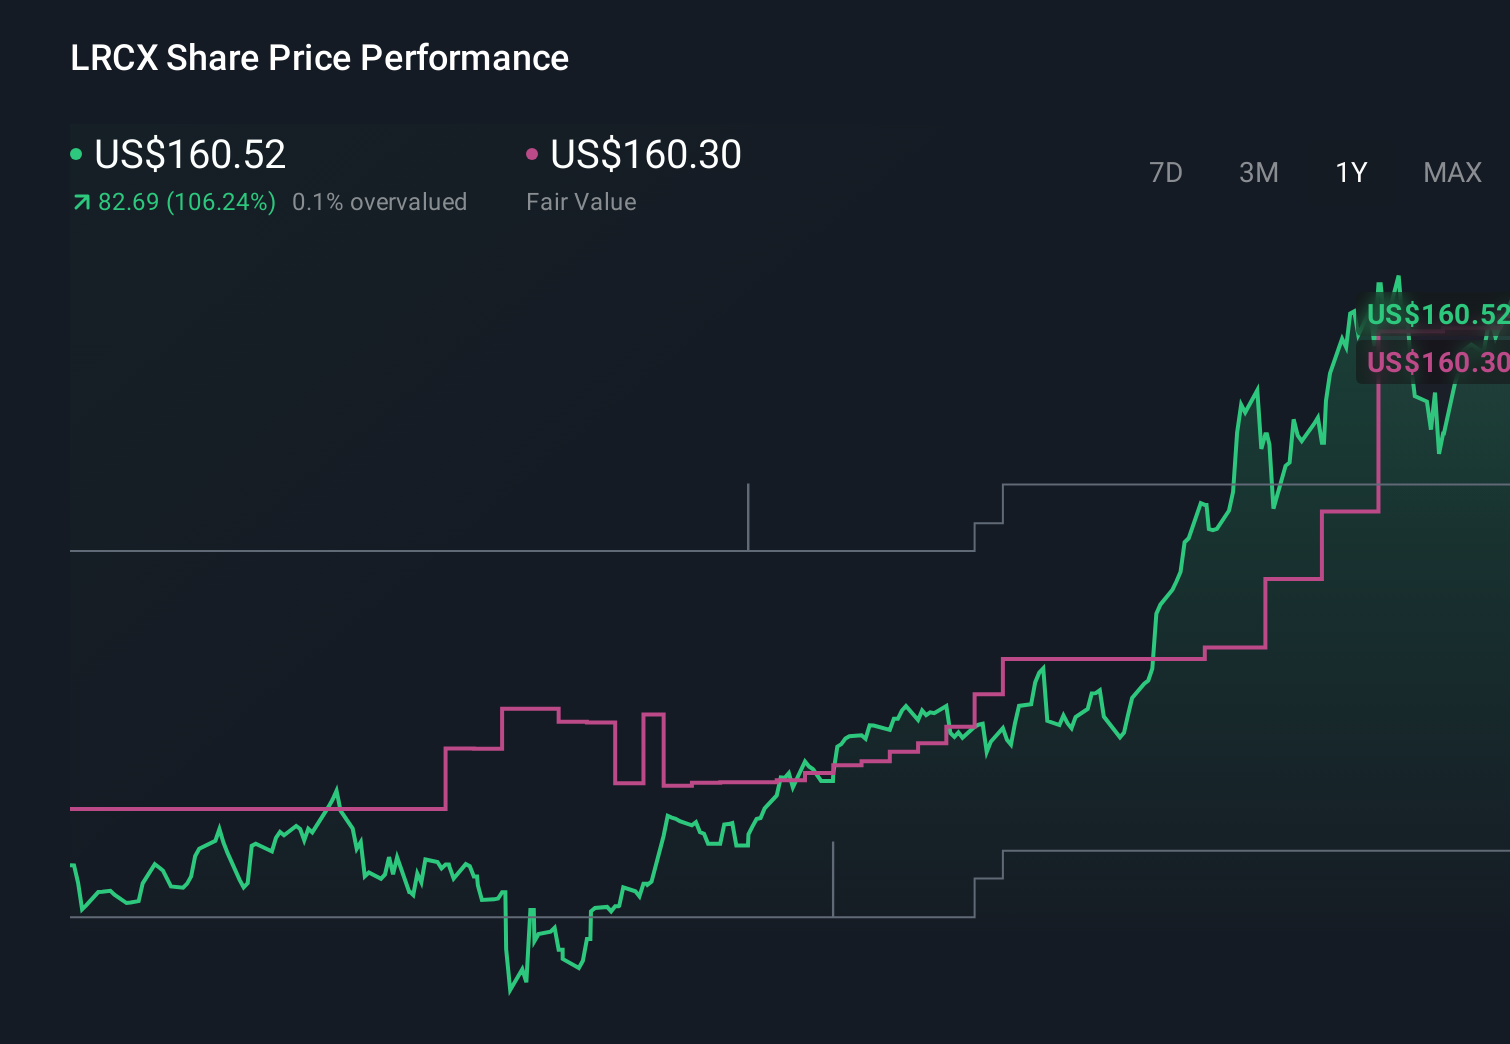
Earlier we mentioned that there is an even better way to think about valuation, and on Simply Wall St that shows up as Narratives. Here you and other investors connect Lam Research’s story to your own forecast for revenue, earnings and margins, arrive at a fair value, and then easily compare that to today’s price on the Community page. The system updates each Narrative as new news or earnings arrive. For example, a bullish Lam view might lean toward the higher fair value of about US$160.30, while a more cautious view might sit closer to the lower price target of US$80.00. This gives you a clear sense of how different perspectives translate into different investment decisions.
Do you think there's more to the story for Lam Research? Head over to our Community to see what others are saying!
This article by Simply Wall St is general in nature. We provide commentary based on historical data and analyst forecasts only using an unbiased methodology and our articles are not intended to be financial advice. It does not constitute a recommendation to buy or sell any stock, and does not take account of your objectives, or your financial situation. We aim to bring you long-term focused analysis driven by fundamental data. Note that our analysis may not factor in the latest price-sensitive company announcements or qualitative material. Simply Wall St has no position in any stocks mentioned.
Have feedback on this article? Concerned about the content? Get in touch with us directly. Alternatively, email editorial-team@simplywallst.com