
Is American Airlines Group (AAL) Pricing In Too Much Concern Over Debt And Travel Recovery?
- If you are wondering whether American Airlines Group at around US$15.99 is a bargain or a value trap, you are not alone. That is exactly what this article is here to unpack.
- The stock has returned 4.3% over the last 7 days and 7.6% over the last 30 days, while the 1-year return sits at a 9.1% decline and the 3-year and 5-year returns are 4.2% and 3.0% respectively.
- Recent headlines have continued to focus on American Airlines Group's debt load, cost pressures and the broader recovery path for air travel, with investors weighing how these factors could affect long term profitability. At the same time, commentary around capacity decisions, labor agreements and operational reliability has been shaping sentiment on how resilient future cash flows might be.
- On our valuation checks, American Airlines Group scores a 4 out of 6, which suggests several traditional methods flag potential value. Next we will walk through these approaches before finishing with a more complete way to think about what the market is really pricing in.
Find out why American Airlines Group's -9.1% return over the last year is lagging behind its peers.
Approach 1: American Airlines Group Discounted Cash Flow (DCF) Analysis
A DCF model takes the cash flows a business is expected to generate in the future and then discounts them back to today to estimate what the whole company could be worth right now.
For American Airlines Group, the model used is a 2 Stage Free Cash Flow to Equity approach, based on free cash flow in dollar terms. The latest twelve month free cash flow sits at about $1.03b. Analysts provide explicit free cash flow estimates for the next few years, and Simply Wall St then extrapolates those further out, giving projected free cash flows up to 2035. By 2029, the model uses a projected free cash flow of $2.03b, with values between 2026 and 2035 ranging from around $549m to almost $2.9b before discounting.
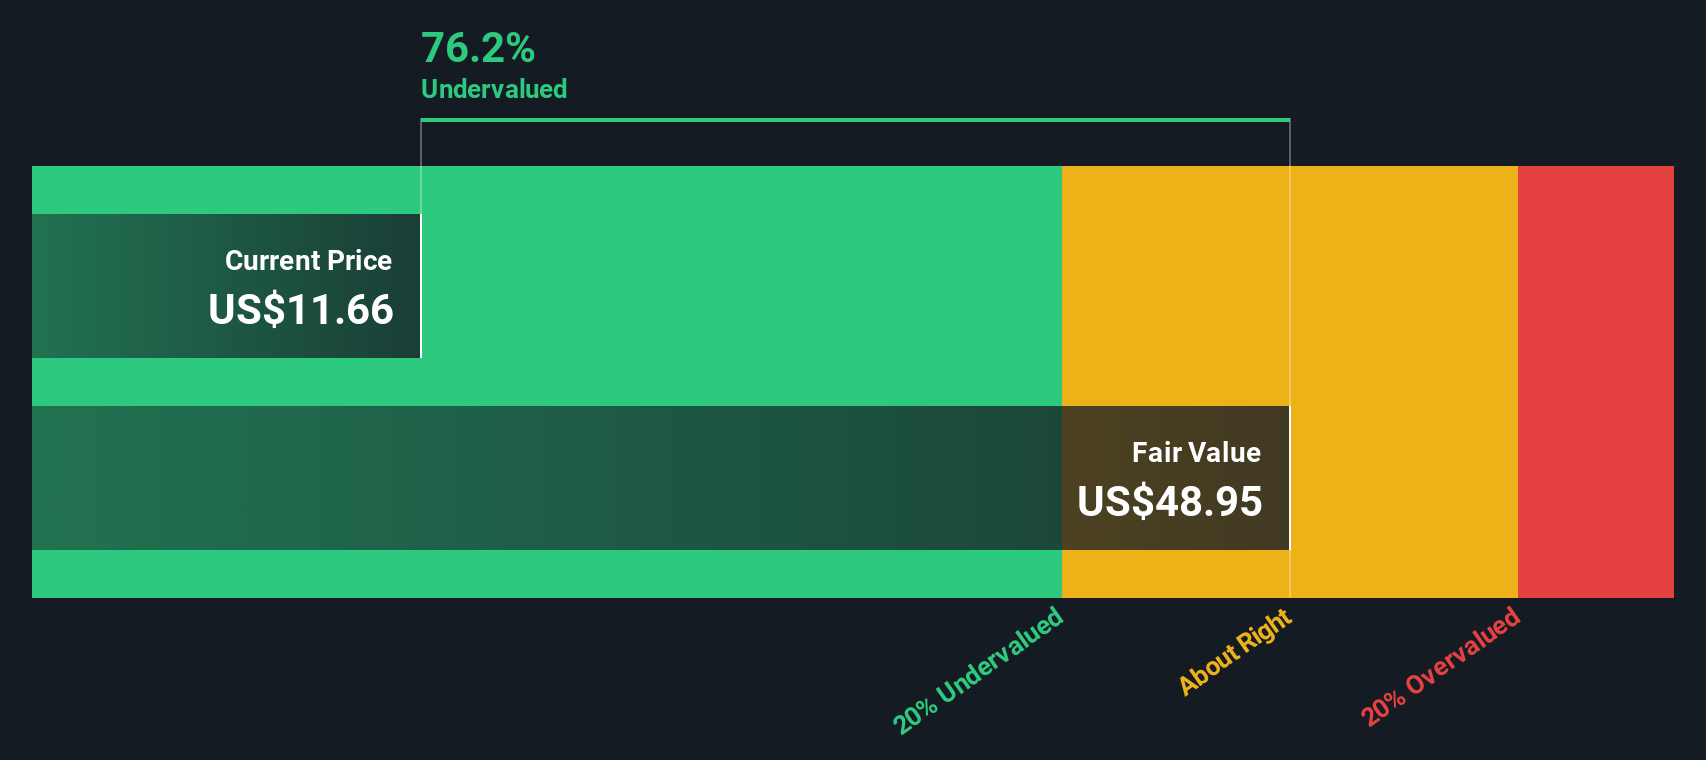
When all of these projected cash flows are discounted back and summed, the model arrives at an estimated intrinsic value of about $30.76 per share. Against a recent share price around $15.99, this DCF output implies the stock trades at roughly a 48.0% discount.
Result: UNDERVALUED
Our Discounted Cash Flow (DCF) analysis suggests American Airlines Group is undervalued by 48.0%. Track this in your watchlist or portfolio, or discover 886 more undervalued stocks based on cash flows.
Approach 2: American Airlines Group Price vs Earnings
For profitable companies, the P/E ratio is a straightforward way to relate what you pay for a share to the earnings that each share generates. It gives you a quick sense of how many years of current earnings the market is pricing in.
What counts as a "normal" P/E often reflects two things: how quickly earnings are expected to change and how much risk investors see in those earnings. Higher growth and lower perceived risk tend to support higher P/E multiples, while slower growth or higher risk usually align with lower P/E levels.
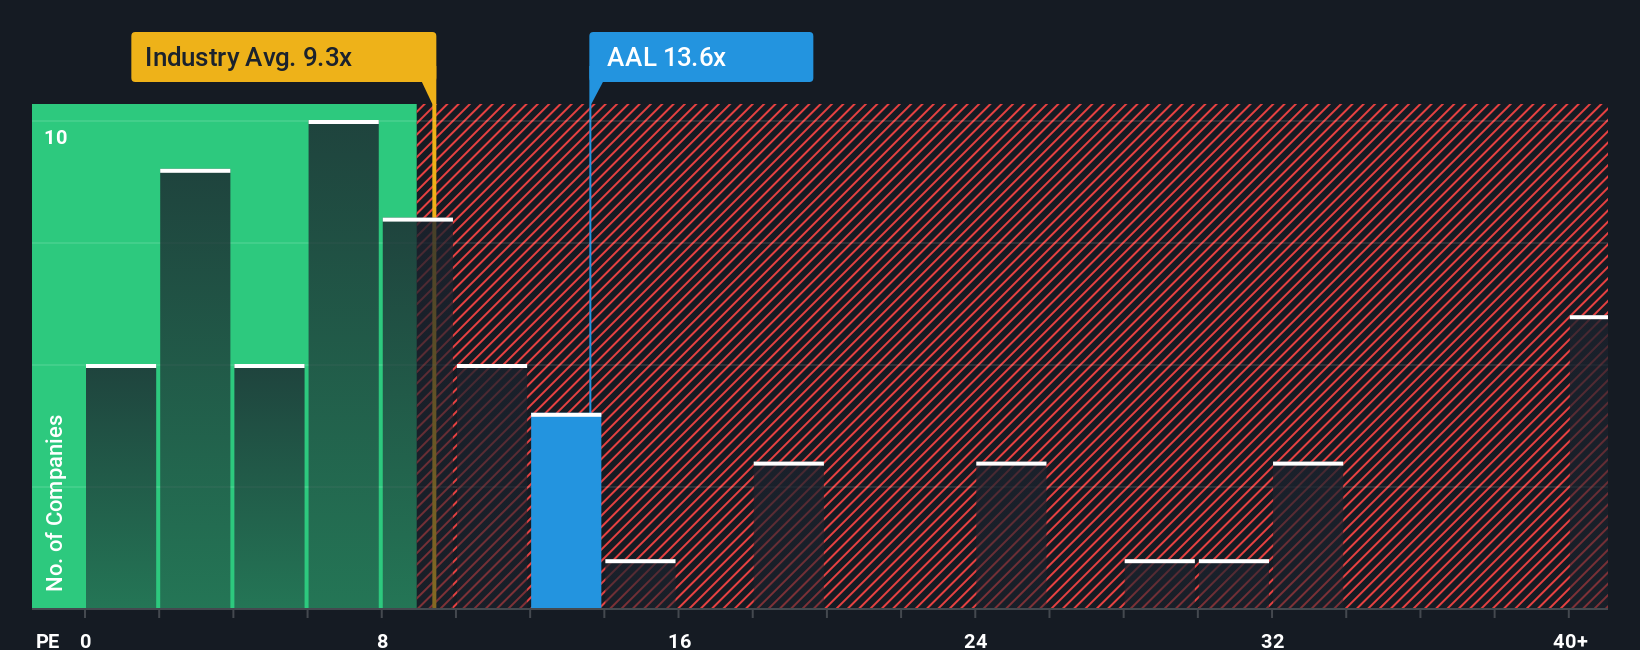
American Airlines Group currently trades on a P/E of 17.53x. That sits above the Airlines industry average of 9.61x, but below the peer group average of 28.41x. Simply Wall St’s Fair Ratio metric for American Airlines Group comes out at 24.08x. This Fair Ratio is a proprietary view of what a more tailored P/E might look like after accounting for factors such as earnings growth characteristics, profit margins, the company’s industry, market value and specific risks.
Because Fair Ratio blends these elements, it can give a more company specific reference point than simple peer or industry comparisons. Lining up the current 17.53x P/E against the 24.08x Fair Ratio suggests American Airlines Group trades below that tailored benchmark.
Result: UNDERVALUED
P/E ratios tell one story, but what if the real opportunity lies elsewhere? Discover 1443 companies where insiders are betting big on explosive growth.
Upgrade Your Decision Making: Choose your American Airlines Group Narrative
Earlier we mentioned that there is an even better way to understand valuation, so let us introduce you to Narratives, which are simply your story about American Airlines Group linked directly to a set of numbers such as your revenue, earnings and margin assumptions, a forecast, and then a fair value that you can compare with the current share price.
On Simply Wall St, Narratives sit inside the Community page and are used by millions of investors as an easy way to write out their view on a company, plug that view into a forecast model, and see what fair value those assumptions imply so you can judge whether the current price looks high or low against your own work.
These Narratives update automatically as new news or earnings data arrive, so you are not locked into a static model, and you always see how fresh information flows through to the forecast and fair value that underpin your decision about whether the gap between price and value is large enough to matter.
For American Airlines Group, one community member currently pins fair value around US$10.61 on concerns about the balance sheet and sensitivity to demand shocks. Another sees fair value nearer US$16.40 based on assumptions around demand recovery, margin changes and a different view on future P/E, which shows how the same stock can look very different depending on the story and numbers you believe.
For American Airlines Group, here are previews of two leading American Airlines Group Narratives:
Here is how a constructive bull case and a cautious bear case line up, using the same share price reference and clearly spelled out assumptions.
🐂 American Airlines Group Bull Case
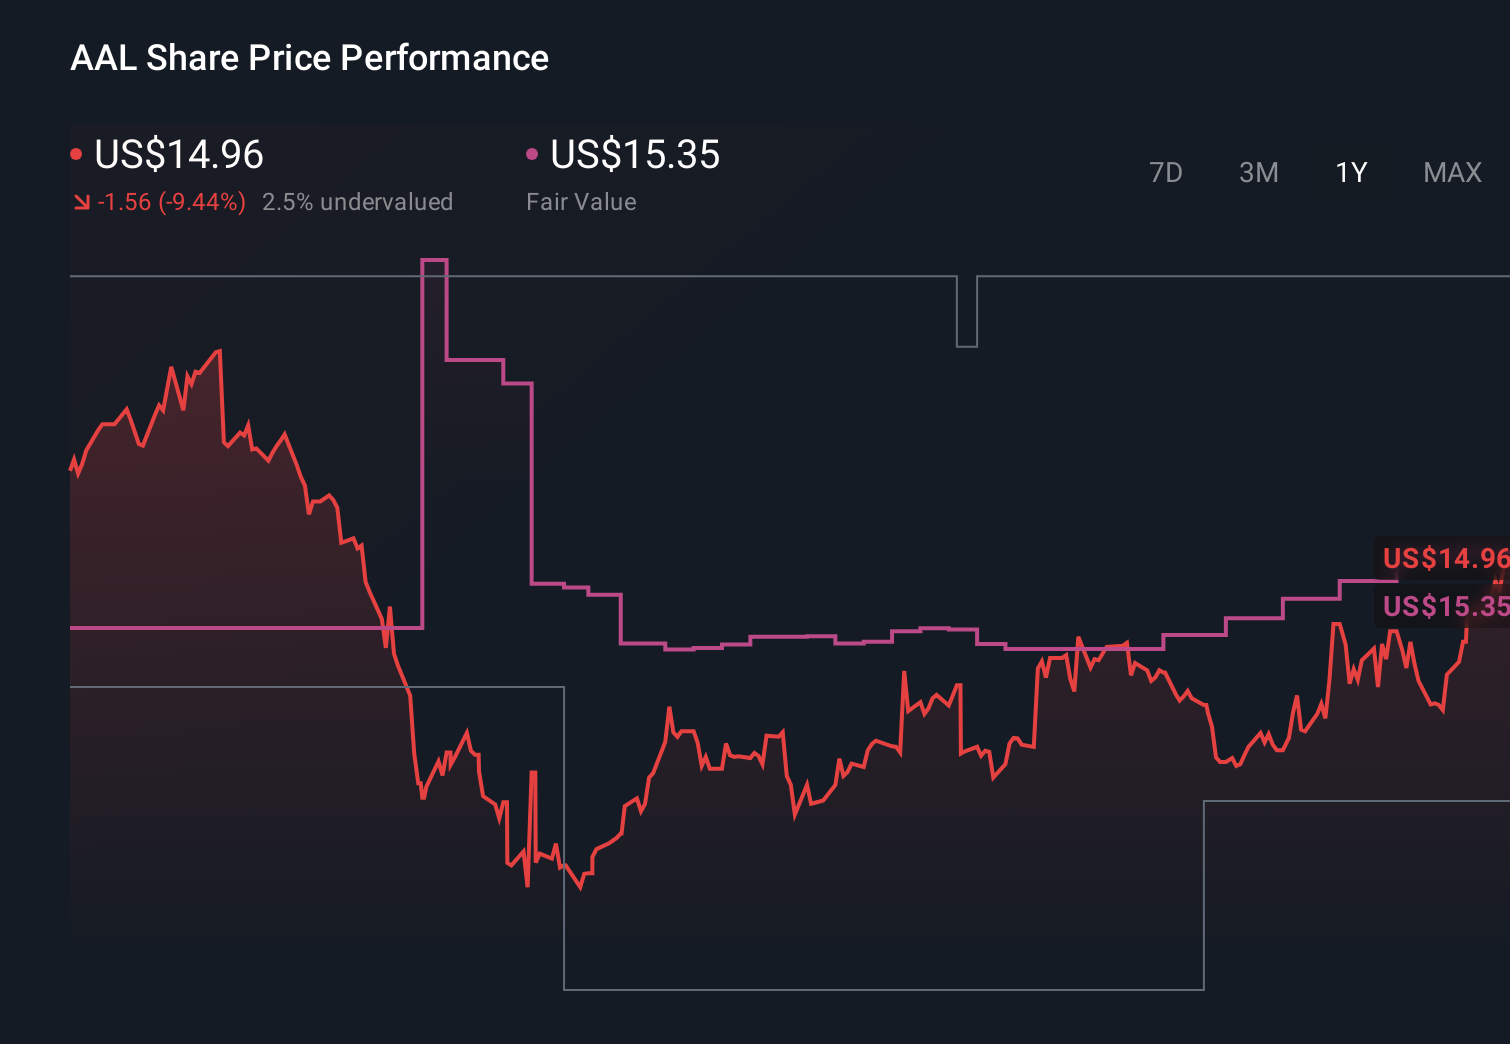
Fair value: US$16.40 per share
Implied discount to fair value vs US$15.99: about 2.5% undervalued
Revenue growth assumption: 5.11% a year
- Sees steady revenue growth supported by domestic demand, premium product upgrades, loyalty program expansion and global alliances feeding higher margin revenue streams over time.
- Assumes profit margins improve from current levels as more efficient aircraft come into the fleet and capital spending stays moderate relative to cash generation.
- Builds in 2028 earnings of about US$1.8b and a future P/E of 8.33x, with a discount rate of 12.5% and a view that the current share price sits slightly below this fair value estimate.
🐻 American Airlines Group Bear Case
Fair value: US$10.61 per share
Implied premium to fair value vs US$15.99: about 50.8% overvalued
Revenue growth assumption: 2.5% a year
- Focuses on the balance sheet, highlighting American Airlines Group's heavy debt load and negative equity position as key reasons for caution.
- Flags sensitivity to demand shocks, especially if travel demand softens or competition for passengers pushes pricing and margins lower in an already competitive industry.
- Concludes that, given these financial and industry risks, the shares only look compelling in very supportive economic conditions, which this narrative does not assume.
Taken together, these Narratives show you the practical trade off. One view leans on improving demand, loyalty economics and efficiency to argue that the current price is a little below what those assumptions support. The other puts more weight on leverage, competition and demand risk and arrives at a fair value well under the current price. Your task is to decide which set of assumptions feels closer to how you think the next few years will play out for American Airlines Group, or to build your own story and numbers inside the Simply Wall St Narrative tools.
Curious how numbers become stories that shape markets? Explore Community Narratives
Do you think there's more to the story for American Airlines Group? Head over to our Community to see what others are saying!
This article by Simply Wall St is general in nature. We provide commentary based on historical data and analyst forecasts only using an unbiased methodology and our articles are not intended to be financial advice. It does not constitute a recommendation to buy or sell any stock, and does not take account of your objectives, or your financial situation. We aim to bring you long-term focused analysis driven by fundamental data. Note that our analysis may not factor in the latest price-sensitive company announcements or qualitative material. Simply Wall St has no position in any stocks mentioned.
Have feedback on this article? Concerned about the content? Get in touch with us directly. Alternatively, email editorial-team@simplywallst.com