
Is It Too Late To Consider Sandisk (SNDK) After A 48% Weekly Surge?
- If you are wondering whether Sandisk's share price still offers value or if the recent run has gone too far, this article will walk through what the numbers are saying today.
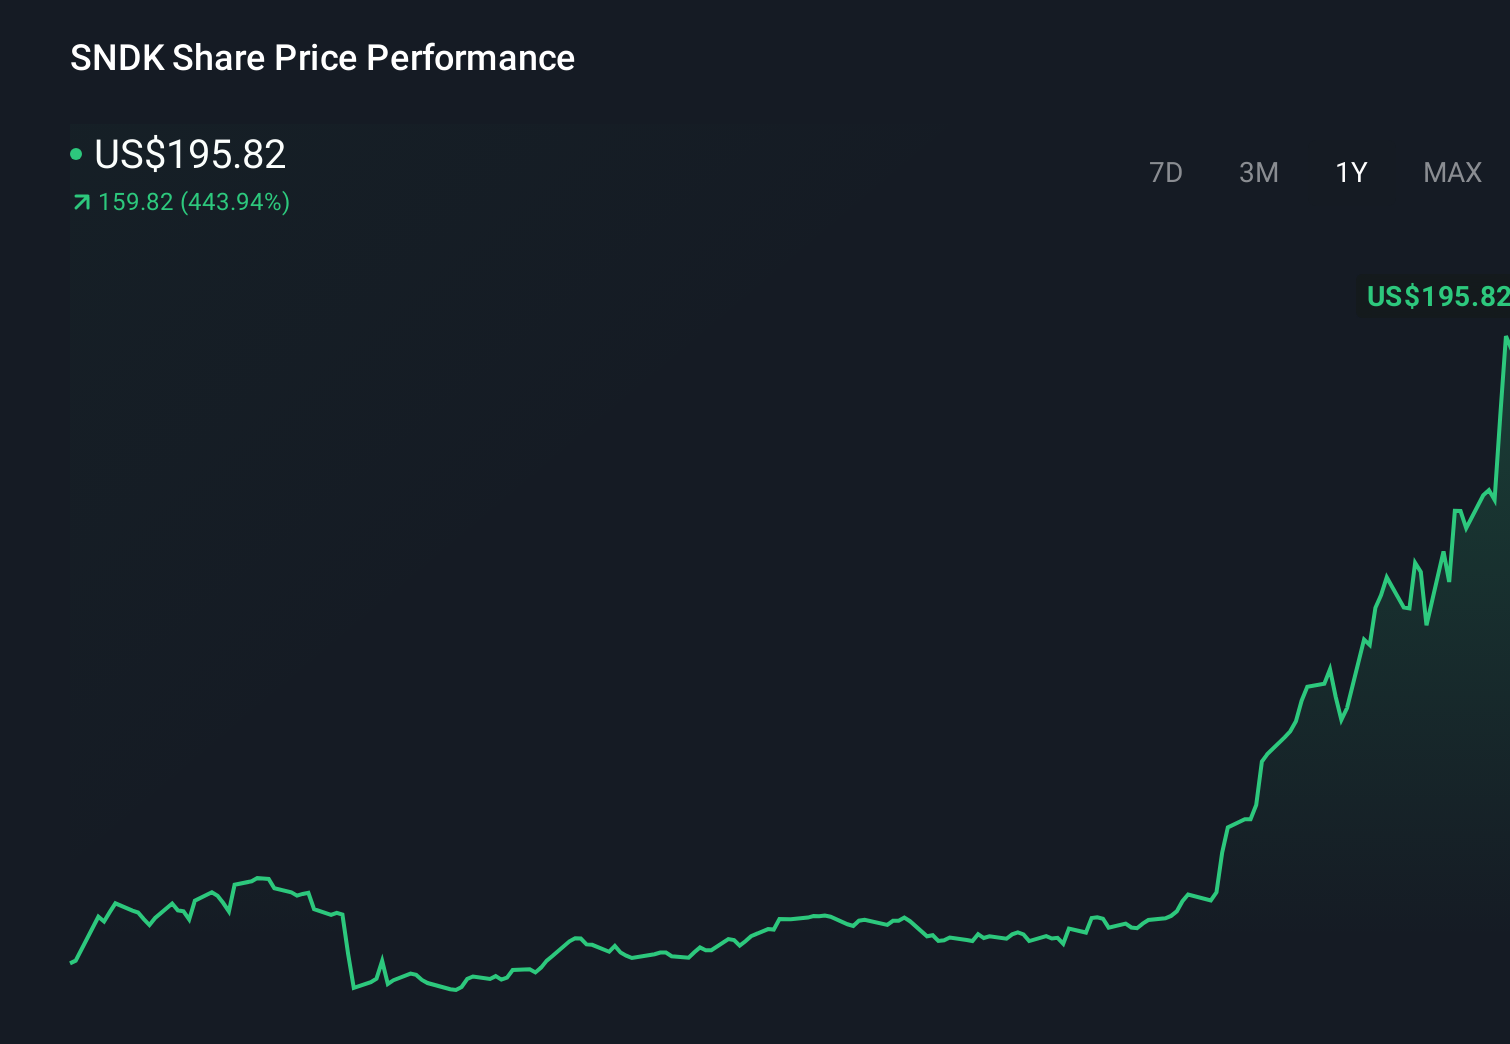
- Sandisk last closed at US$353.56, with returns of 48.9% over 7 days, 61.1% over 30 days and 28.5% year to date, which has naturally raised questions about future risk and reward.
- Recent headlines around Sandisk have focused on its position in the broader tech sector and how sentiment toward the stock has shifted as investors reassess growth and profitability expectations. This changing tone in coverage helps frame whether the recent share price moves are driven more by fundamentals or by changing market mood.
- Our valuation checks give Sandisk a 2/6 valuation score, which means only 2 of 6 measures currently point to the shares looking undervalued. We will look at how different valuation approaches line up on this, before ending with a way to frame value that goes beyond the usual ratios.
Sandisk scores just 2/6 on our valuation checks. See what other red flags we found in the full valuation breakdown.
Approach 1: Sandisk Discounted Cash Flow (DCF) Analysis
A DCF model takes estimates of a company’s future cash flows and discounts them back to today’s dollars, to see what those future streams might be worth right now.
For Sandisk, the model uses a 2 Stage Free Cash Flow to Equity approach. The latest twelve month free cash flow is about $481.4 million. Analysts provide explicit free cash flow estimates through 2028, with Simply Wall St extrapolating out to 2035. For example, the model includes a projected free cash flow of $3.19b in 2028, with intermediate and later years stepping up from current levels according to the inputs you see in the forecast table.
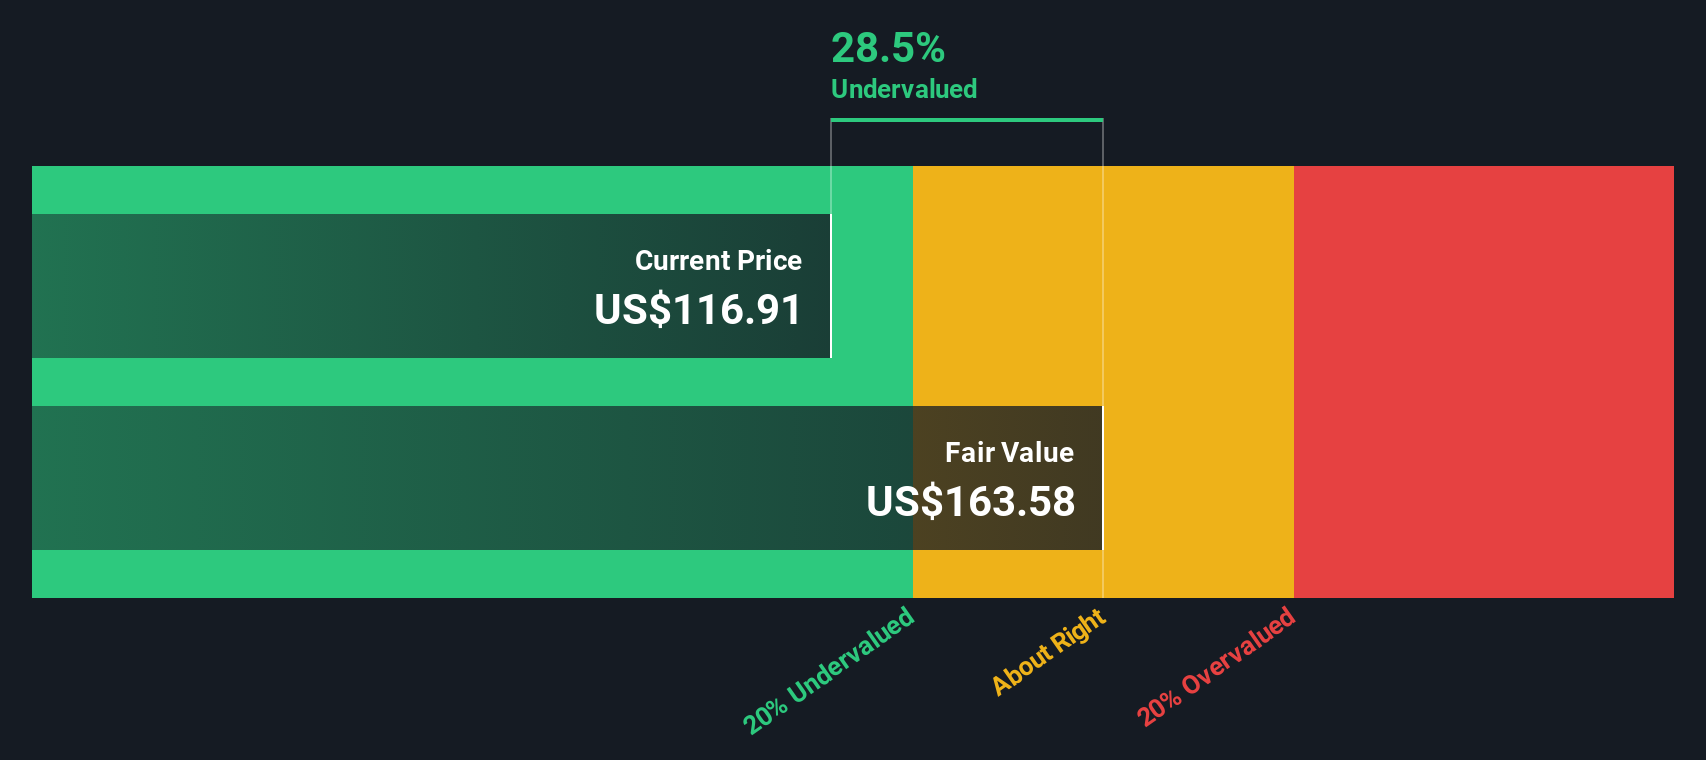
Discounting those projected cash flows back to today produces an estimated intrinsic value of about $504.99 per share. Compared with the recent share price of $353.56, this implies roughly a 30.0% discount. This indicates that Sandisk is trading below this cash flow based estimate of value.
Result: UNDERVALUED
Our Discounted Cash Flow (DCF) analysis suggests Sandisk is undervalued by 30.0%. Track this in your watchlist or portfolio, or discover 884 more undervalued stocks based on cash flows.
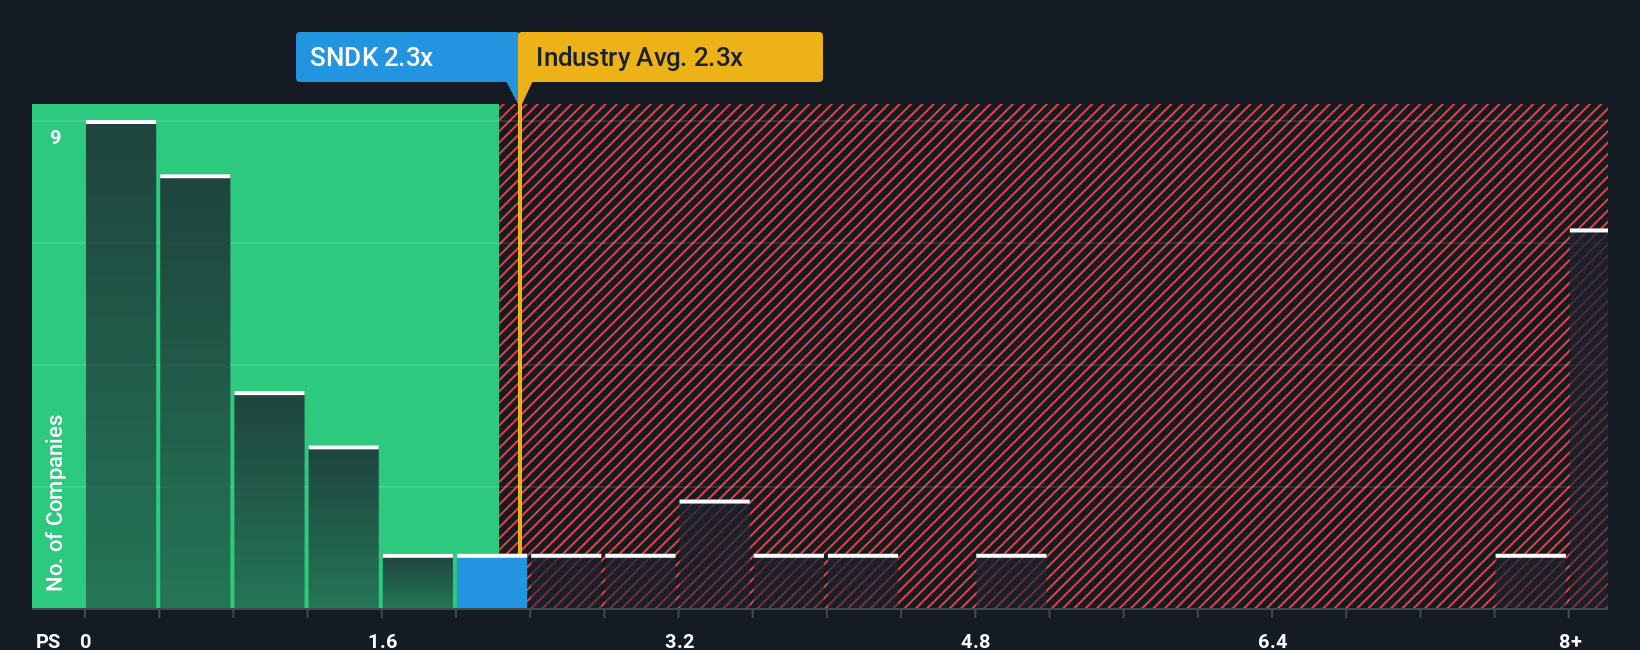
Approach 2: Sandisk Price vs Sales
For companies where revenue is a key focus, the P/S ratio is a useful yardstick because it compares what the market is paying for each dollar of sales, regardless of current profits. Higher growth expectations or lower perceived risk can justify a higher P/S multiple, while slower expected growth or higher risk usually points to a lower, more conservative range.
Sandisk currently trades on a P/S of 6.66x. That sits above both the broader Tech industry average P/S of 1.56x and the peer group average of 4.31x. This indicates the market is currently assigning a richer sales multiple than these benchmarks. Simply Wall St’s Fair Ratio for Sandisk is 3.57x, which is the P/S level their model suggests based on factors such as earnings growth, industry, profit margin, market cap and risks.
The Fair Ratio offers a more tailored reference point than a simple comparison with peers or the sector because it blends company specific traits, including growth profile, risk level and profitability, with its industry and size. Comparing the 3.57x Fair Ratio with the current 6.66x suggests Sandisk’s shares are pricing in more optimism than the model implies.
Result: OVERVALUED
P/S ratios tell one story, but what if the real opportunity lies elsewhere? Discover 1443 companies where insiders are betting big on explosive growth.
Upgrade Your Decision Making: Choose your Sandisk Narrative
Earlier we mentioned that there is an even better way to understand valuation, so let us introduce you to Narratives, which give you a clear story behind the numbers you are using for Sandisk’s fair value, revenue, earnings and margins.
A Narrative is simply your view of Sandisk written into a forecast, linking what you believe about the business to specific assumptions and then to a fair value that you can compare with today’s price.
On Simply Wall St, within the Community page used by millions of investors, Narratives are easy to set up and adjust, and they update automatically when fresh information like news or earnings is added.
This helps you decide when Sandisk looks attractive or stretched by comparing your Narrative based fair value to the current share price, and it also shows how another investor might see a much higher or much lower fair value for the same company based on different assumptions.
Do you think there's more to the story for Sandisk? Head over to our Community to see what others are saying!
This article by Simply Wall St is general in nature. We provide commentary based on historical data and analyst forecasts only using an unbiased methodology and our articles are not intended to be financial advice. It does not constitute a recommendation to buy or sell any stock, and does not take account of your objectives, or your financial situation. We aim to bring you long-term focused analysis driven by fundamental data. Note that our analysis may not factor in the latest price-sensitive company announcements or qualitative material. Simply Wall St has no position in any stocks mentioned.
Have feedback on this article? Concerned about the content? Get in touch with us directly. Alternatively, email editorial-team@simplywallst.com