
Is Nvidia (NVDA) Still Sensibly Priced After Its Large Multi Year Share Price Surge
- If you are wondering whether NVIDIA's share price still makes sense after its large rise, the key question is how that price compares with what the business might be worth.
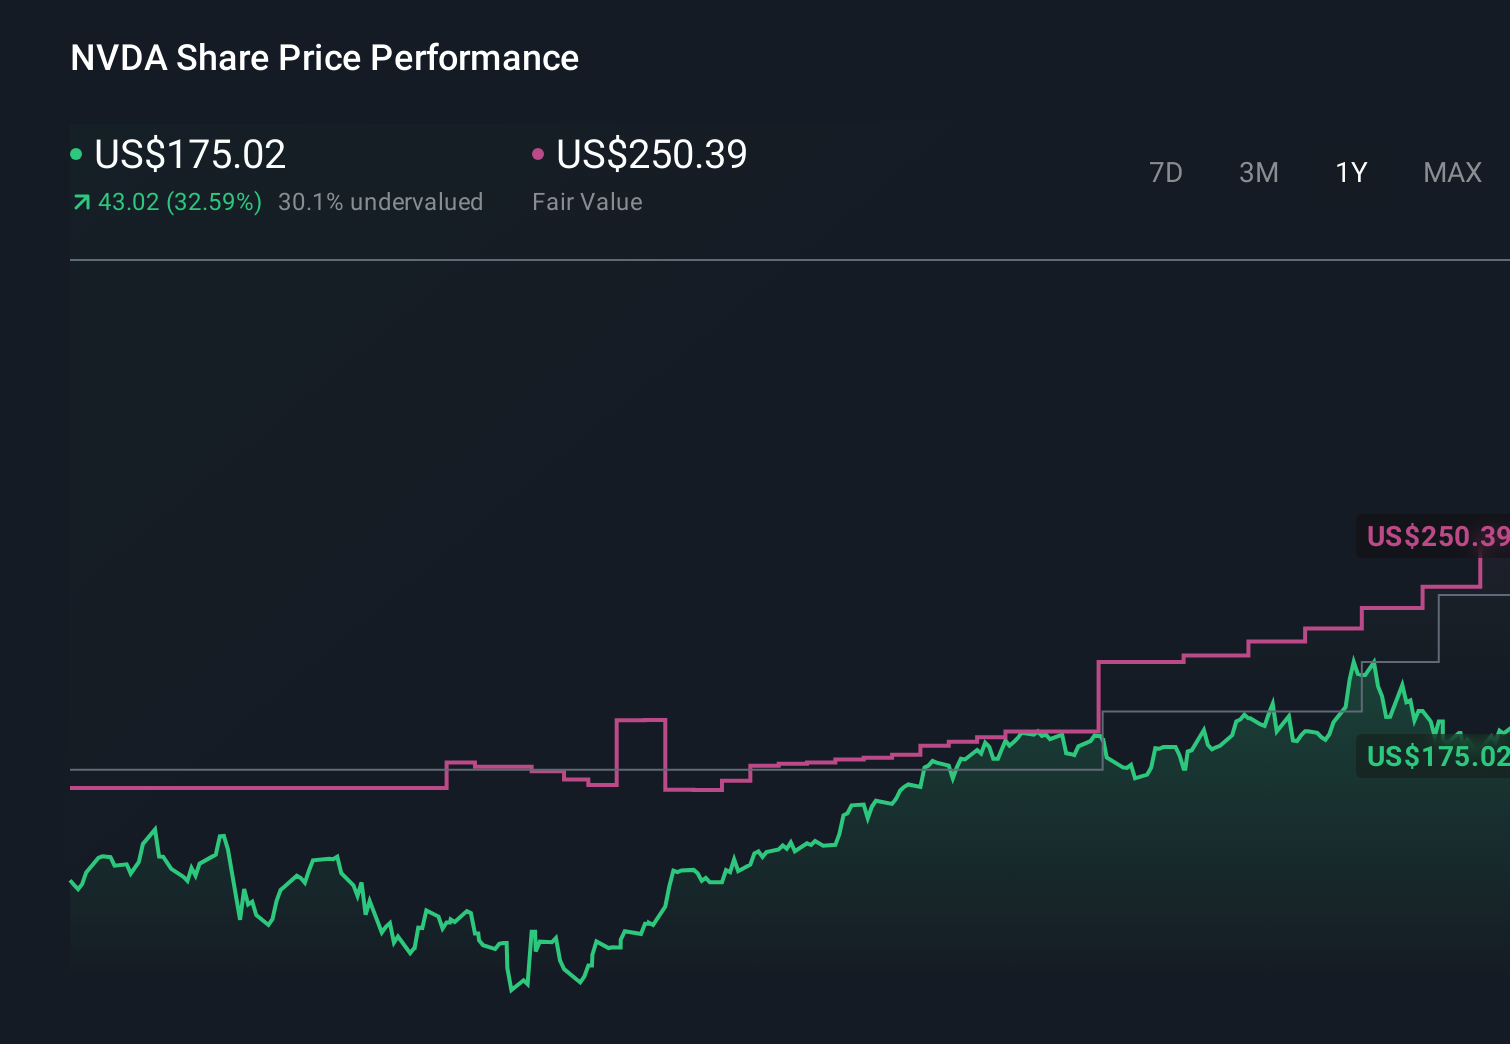
- NVIDIA closed at US$189.11, with returns of 1.4% over the last 7 days, 2.2% over the last 30 days, 0.1% year to date, 35.0% over 1 year and a very large gain over 3 and 5 years.
- Recent market attention has centered on NVIDIA's role in graphics processing units and data center chips used in areas like gaming, artificial intelligence and high performance computing. These themes have kept the stock in focus as investors consider how much of that potential may already be reflected in the current price.
- Simply Wall St gives NVIDIA a valuation score of 2 out of 6. Next, we will look at what different valuation approaches suggest about that score, before finishing with a broader way to think about value that goes beyond the usual numbers.
NVIDIA scores just 2/6 on our valuation checks. See what other red flags we found in the full valuation breakdown.
Approach 1: NVIDIA Discounted Cash Flow (DCF) Analysis
The DCF model takes NVIDIA’s projected future cash flows and discounts them back to today’s dollars, giving an estimate of what the business might be worth right now based on those cash flows.
NVIDIA’s latest twelve month Free Cash Flow is about $77.96b. Simply Wall St uses a 2 stage Free Cash Flow to Equity model, combining analyst forecasts for the next few years with longer term extrapolations. For example, projected Free Cash Flow for 2030 is $287.49b, with discounted values provided for each year out to 2035.
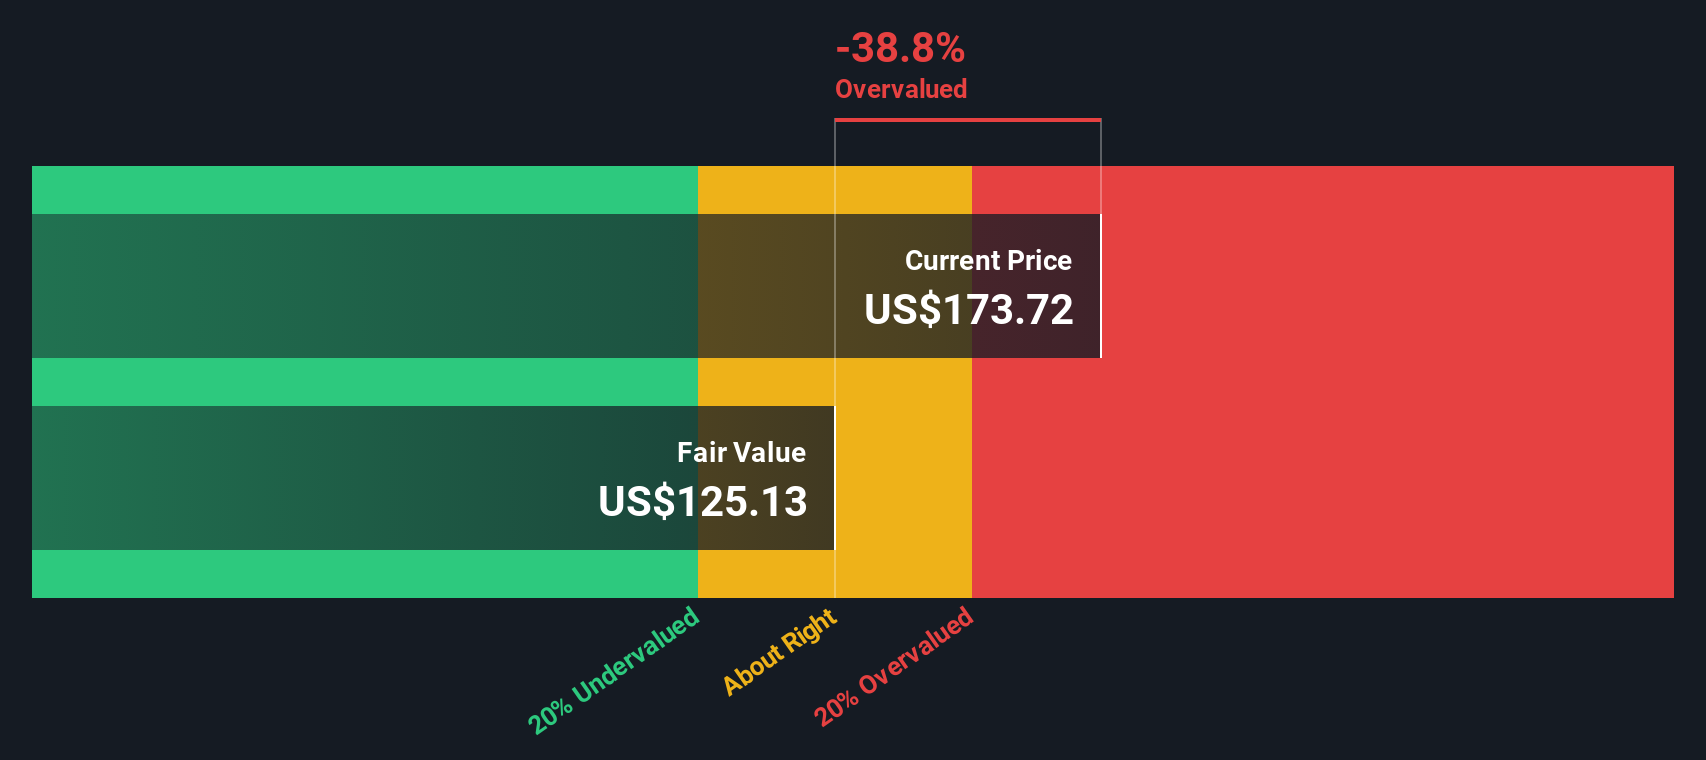
On this basis, the model arrives at an estimated intrinsic value of $161.78 per share. Compared with the recent share price of $189.11, the DCF output suggests the stock is about 16.9% above this estimate, so the model points to the shares being overvalued on these cash flow assumptions.
Result: OVERVALUED
Our Discounted Cash Flow (DCF) analysis suggests NVIDIA may be overvalued by 16.9%. Discover 884 undervalued stocks or create your own screener to find better value opportunities.
Approach 2: NVIDIA Price vs Earnings
For a profitable company like NVIDIA, the P/E ratio is a useful way to think about value because it links what you pay today with the earnings the business is already generating. Investors usually accept a higher P/E when they expect stronger growth or see lower risk, and look for a lower P/E when growth expectations are more modest or risks feel higher.
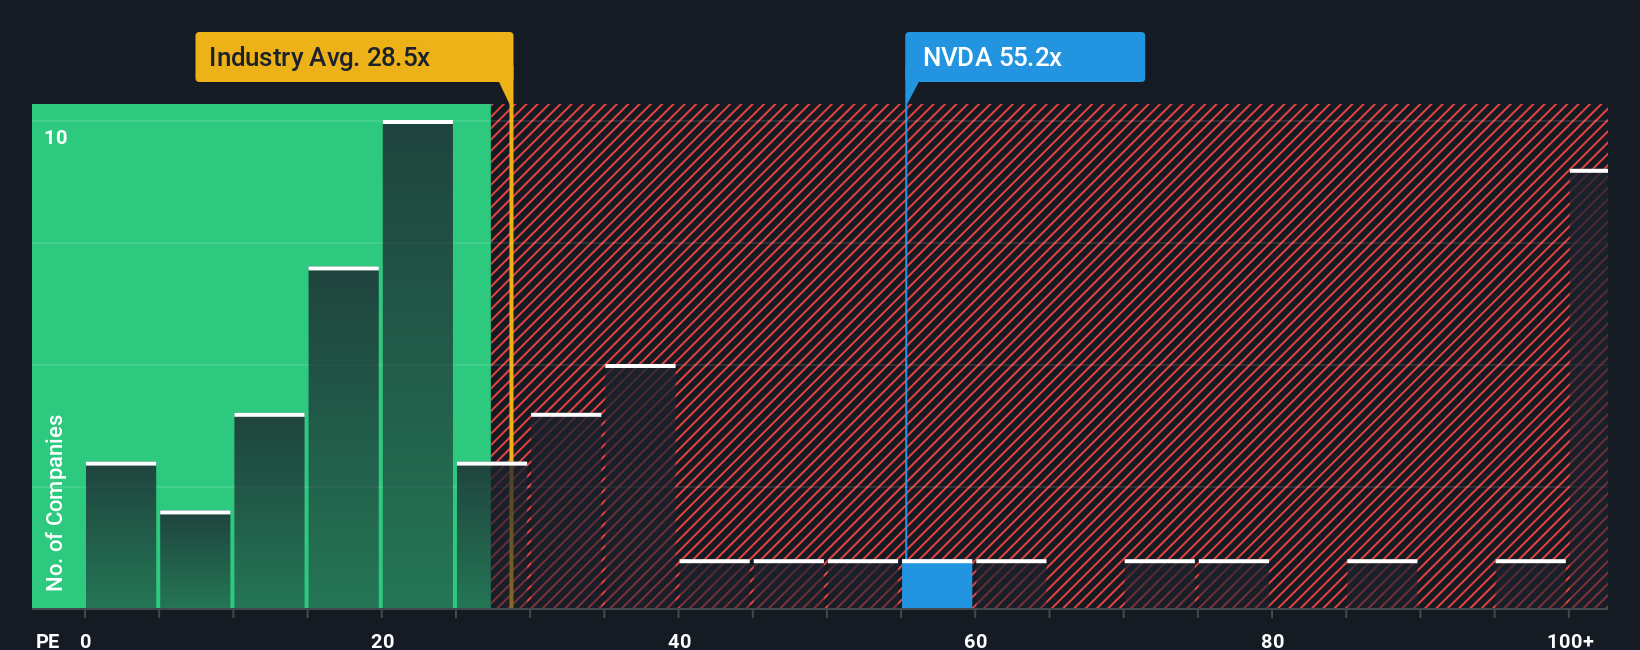
NVIDIA currently trades on a P/E of 46.32x. That sits above the broader semiconductor industry average P/E of 42.34x, but below the peer group average of 61.57x. Simply Wall St also calculates a “Fair Ratio” of 57.41x for NVIDIA. This is a proprietary estimate of what a reasonable P/E could be given factors such as the company’s earnings growth profile, margins, size, industry and specific risks.
The Fair Ratio can be more informative than a simple peer or industry comparison because it adjusts for NVIDIA’s own characteristics, rather than assuming all semiconductor stocks deserve similar multiples. With the current P/E of 46.32x sitting below the Fair Ratio of 57.41x, this framework points to NVIDIA trading below that estimated fair earnings multiple.
Result: UNDERVALUED
P/E ratios tell one story, but what if the real opportunity lies elsewhere? Discover 1443 companies where insiders are betting big on explosive growth.
Upgrade Your Decision Making: Choose your NVIDIA Narrative
Earlier we mentioned that there is an even better way to think about value than just ratios and models. Let us introduce Narratives, which let you attach a clear story to your numbers by linking your view of NVIDIA’s future revenue, earnings and margins to a forecast, and then to a fair value you can compare with today’s price.
On Simply Wall St, Narratives sit inside the Community page and are used by millions of investors. They give you an easy tool to say, in plain language, what you think will happen and then back it up with assumptions that the platform turns into projected cash flows, earnings and a fair value per share.
Because Narratives are refreshed when new earnings, news or other data arrive, your NVIDIA view is not a one off spreadsheet. It evolves automatically and keeps your fair value estimate aligned with the latest information rather than leaving it frozen in time.
For example, one NVIDIA Narrative on Simply Wall St currently sets fair value at about US$104 per share while another sits near US$345. Both are built from the same framework, so you can see how different investors can look at the same company, plug in very different assumptions and then decide whether the current price looks high or low against their own fair value line.
For NVIDIA however, we will make it really easy for you with previews of two leading NVIDIA Narratives:
Fair value in this narrative: US$253.02 per share
Implied discount vs last close: about 25.3% below this fair value estimate
Revenue growth assumption: 30.9% a year
- Analysts see NVIDIA as a core AI infrastructure provider, with demand tied to large data center and AI factory buildouts across cloud, sovereign and enterprise customers.
- The narrative expects full stack offerings in compute, networking and software to support high profit margins and recurring revenue as AI workloads expand.
- Key uncertainties include export controls, custom silicon from large customers, reliance on TSMC, and energy or regulatory limits on future AI data center buildout.
Fair value in this narrative: US$90.15 per share
Implied premium vs last close: about 109.7% above this fair value estimate
Revenue growth assumption: 15.9% a year
- This narrative argues that NVIDIA is priced for perfection, with very high margins and a valuation that already bakes in a large share of the future AI market.
- It highlights rising competition from alternative accelerators, custom chips at major cloud providers, and more efficient AI software that could reduce future GPU demand.
- The author applies Aswath Damodaran's long term revenue and margin assumptions to reach a fair value near US$90, with a future P/E of 18.4x and continued exposure to supply chain and China related risks.
These two narratives show how reasonable assumptions can still lead to very different fair value views for the same stock. This is why your own expectations for growth, margins and competition matter so much when you look at where NVIDIA trades today.
Curious how numbers become stories that shape markets? Explore Community Narratives
Do you think there's more to the story for NVIDIA? Head over to our Community to see what others are saying!
This article by Simply Wall St is general in nature. We provide commentary based on historical data and analyst forecasts only using an unbiased methodology and our articles are not intended to be financial advice. It does not constitute a recommendation to buy or sell any stock, and does not take account of your objectives, or your financial situation. We aim to bring you long-term focused analysis driven by fundamental data. Note that our analysis may not factor in the latest price-sensitive company announcements or qualitative material. Simply Wall St has no position in any stocks mentioned.
Have feedback on this article? Concerned about the content? Get in touch with us directly. Alternatively, email editorial-team@simplywallst.com