
Assessing Symbotic (SYM) Valuation After Strong Revenue Growth And Higher AI And Robotics Investment
Recent updates around Symbotic (SYM) center on strong reported revenue growth in fiscal 2024 and heavier spending on AI and robotics. These developments have stirred investor interest ahead of upcoming earnings and potential partnership announcements.
See our latest analysis for Symbotic.
Against this backdrop, Symbotic’s share price has settled at US$69.62 after a 1 day share price return of a 1.18% decline. A 7 day share price return of 17.01% and 30 day share price return of 15.11% suggest momentum has picked up again, supported by a 1 year total shareholder return of 163.21% and a very large 3 year total shareholder return of around 4.2x.
If Symbotic’s AI focus has caught your attention, this could be a good moment to widen the lens and look at high growth tech and AI stocks that are also drawing interest.
With Symbotic posting strong reported revenue growth, a recent share price pullback, and a value score of 1 alongside a reported 52.6% intrinsic premium, the key question is whether this is a genuine opening or if the market is already pricing in future growth.
Most Popular Narrative: 13% Overvalued
With Symbotic’s fair value in the most followed narrative sitting at US$61.71 versus a last close of US$69.62, expectations embedded in that view are clearly higher than the model suggests.
The Future P/E Multiple has risen significantly, from about 17.9x to 23.2x, signaling a higher valuation being placed on expected future earnings.
Curious what kind of revenue ramp, margin shift, and earnings profile could justify that richer future earnings multiple? The full narrative lays out an aggressive growth arc, rising profitability, and a higher required return that together drive this fair value call without spelling out every assumption upfront.
Result: Fair Value of $61.71 (OVERVALUED)
Have a read of the narrative in full and understand what's behind the forecasts.
However, this story can change quickly if deployment timing slips during the next generation rollout, or if heavy investment and customer concentration start to pressure earnings visibility.
Find out about the key risks to this Symbotic narrative.
Another View: What Our DCF Model Is Saying
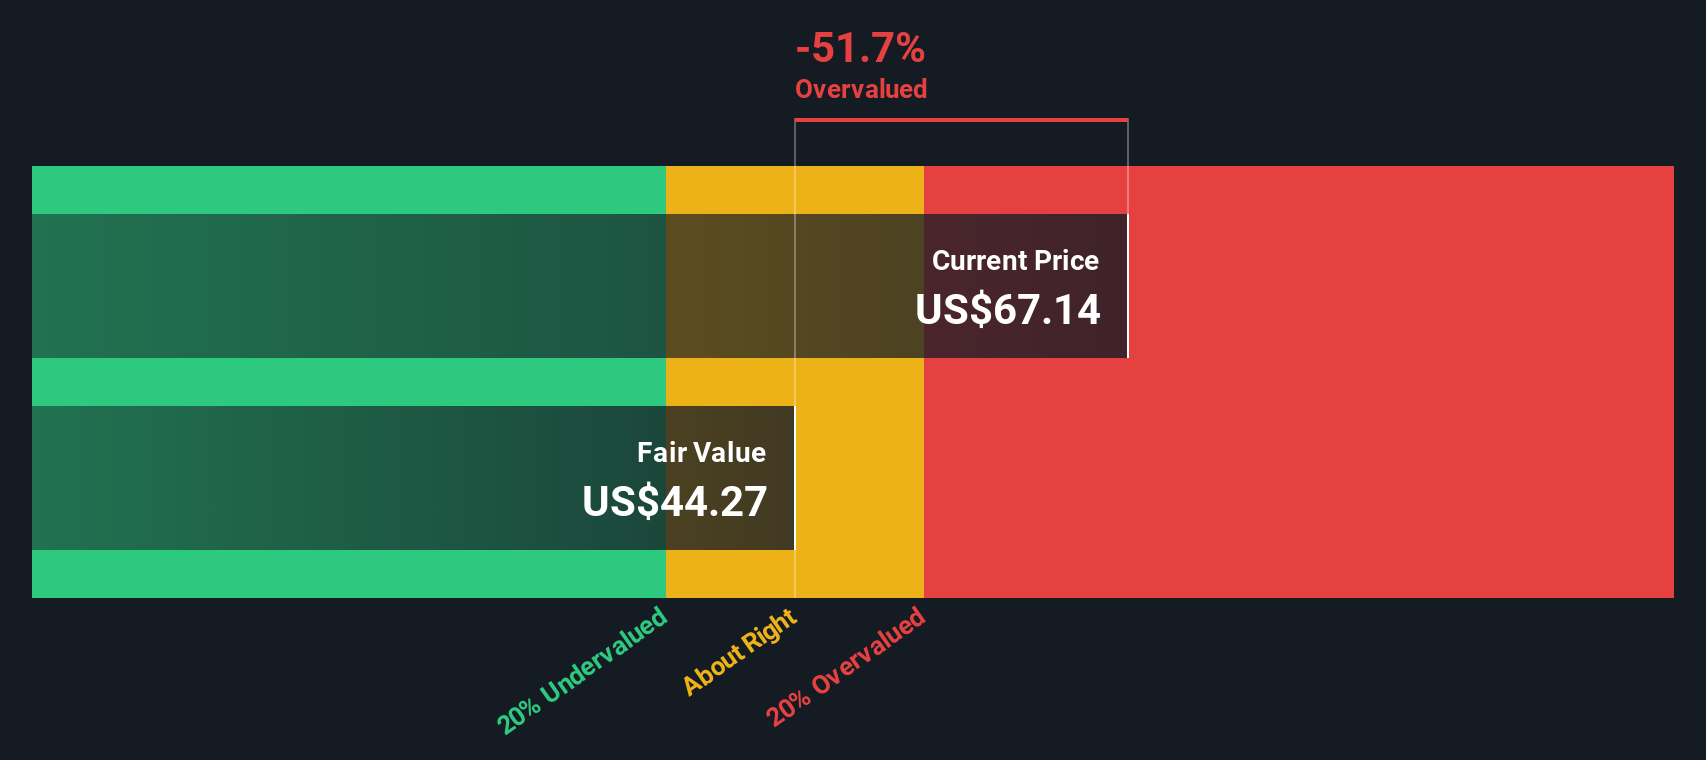
The most followed narrative pegs Symbotic at a fair value of US$61.71, which points to the shares looking overvalued against the current US$69.62 price. Our DCF model is even tougher, with a fair value of US$45.62, so it also flags the stock as overvalued. With two methods both landing below the market price, what would need to change in your assumptions for that gap to feel comfortable?
Look into how the SWS DCF model arrives at its fair value.
Build Your Own Symbotic Narrative
If you see the numbers differently or want to stress test these assumptions yourself, you can build a custom view in just a few minutes by starting with Do it your way.
A great starting point for your Symbotic research is our analysis highlighting 1 key reward and 2 important warning signs that could impact your investment decision.
Looking for more investment ideas?
If Symbotic has sharpened your focus, do not stop here. Broaden your watchlist now so you are not late to the next opportunity.
- Spot potential turnaround names by scanning these 3545 penny stocks with strong financials that combine smaller market caps with stronger balance sheets and fundamentals.
- Ride the AI wave in a more targeted way by checking out these 26 AI penny stocks that concentrate exposure in this theme.
- Zero in on price and cash flow alignment with these 884 undervalued stocks based on cash flows, built to highlight opportunities where fundamentals and valuation screens intersect.
This article by Simply Wall St is general in nature. We provide commentary based on historical data and analyst forecasts only using an unbiased methodology and our articles are not intended to be financial advice. It does not constitute a recommendation to buy or sell any stock, and does not take account of your objectives, or your financial situation. We aim to bring you long-term focused analysis driven by fundamental data. Note that our analysis may not factor in the latest price-sensitive company announcements or qualitative material. Simply Wall St has no position in any stocks mentioned.
Have feedback on this article? Concerned about the content? Get in touch with us directly. Alternatively, email editorial-team@simplywallst.com