
Is It Too Late To Consider SCREEN Holdings (TSE:7735) After Its Strong Multi Year Rally?
- If you are wondering whether SCREEN Holdings is still reasonably priced after its strong run, or if the easy money has already been made, this article walks through what the current share price might actually imply about value.
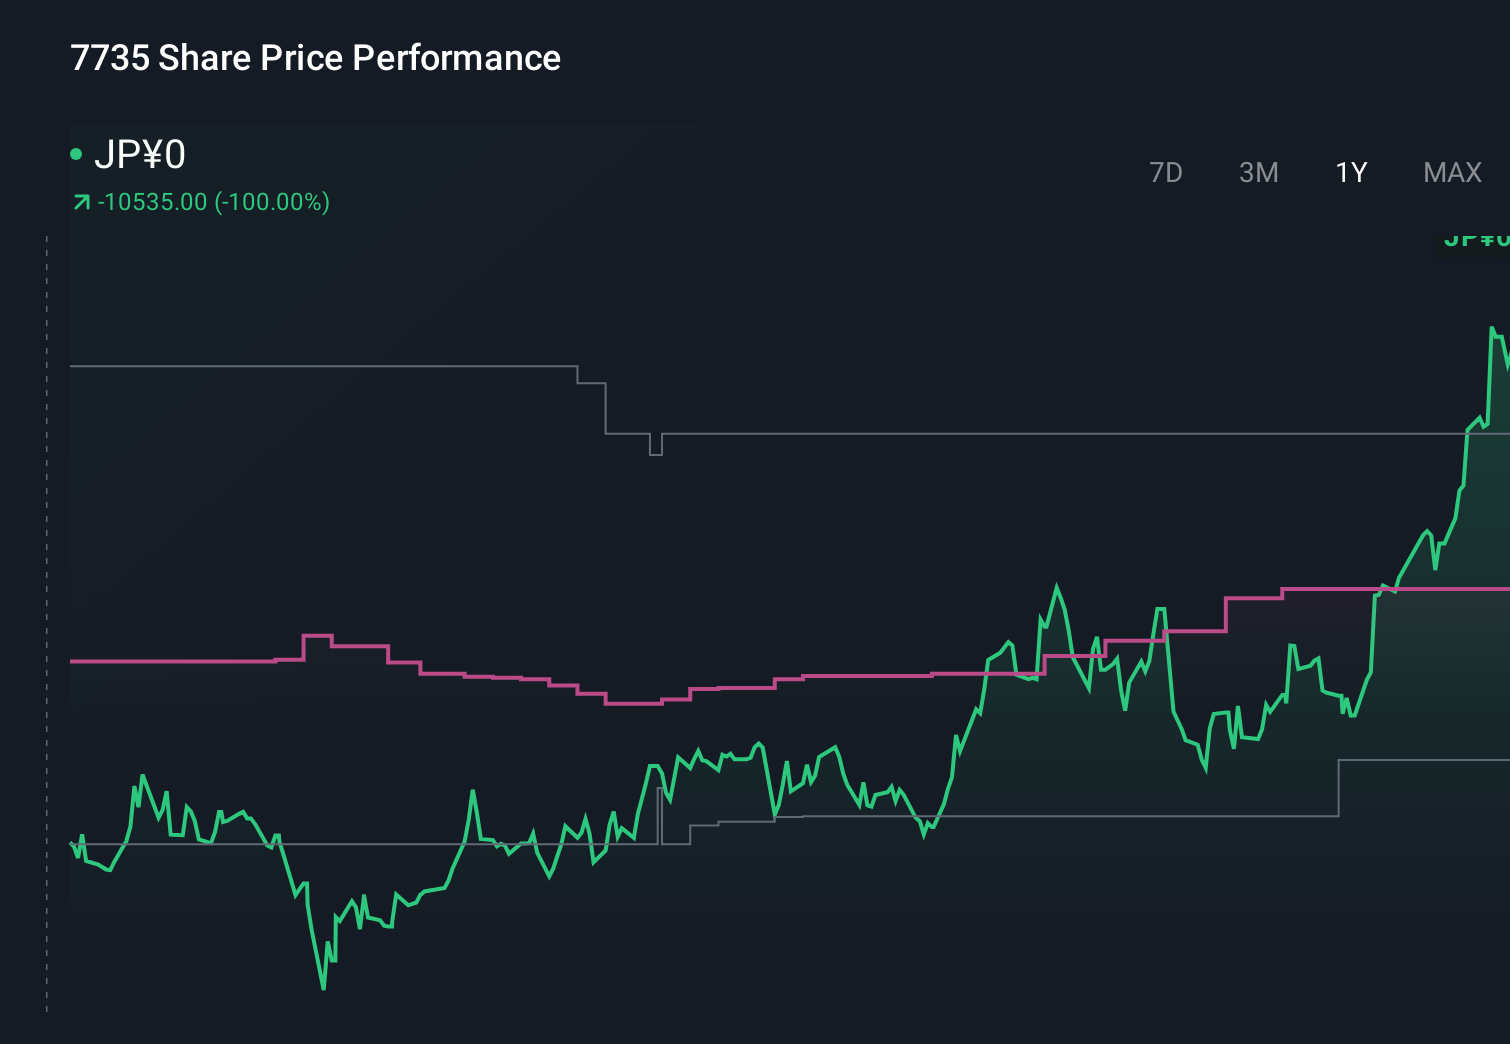
- At a last close of ¥15,410, the stock has returned 1.1% over the past week and 12.0% over the last month, with a 56.0% return over 1 year and a very large 3 year gain of 269.1%. However, the year-to-date figure sits at a 3.7% decline and the 5 year return is 318.8%.
- Recent coverage has focused on SCREEN Holdings as a key semiconductor equipment name, with investors paying close attention to sector sentiment and demand expectations for chip making tools. Media discussion around supply chain investment, capital expenditure plans at major chip producers, and broader interest in semiconductor related stocks helps frame the moves you see in SCREEN's share price.
- Right now, SCREEN Holdings scores 3 out of 6 on our valuation checks, and you can see the full breakdown in the valuation score. Next, we will look at what different valuation methods suggest about the stock, and then finish with a broader way to think about value that goes beyond a single model.
Find out why SCREEN Holdings's 56.0% return over the last year is lagging behind its peers.
Approach 1: SCREEN Holdings Discounted Cash Flow (DCF) Analysis
A Discounted Cash Flow, or DCF, model estimates what a business could be worth by projecting its future cash flows and then discounting those back to today using a required rate of return.
For SCREEN Holdings, the model used is a 2 Stage Free Cash Flow to Equity approach. The latest twelve month free cash flow is about ¥34,907 million, and analysts plus extrapolated estimates point to free cash flow of ¥110,931 million by 2030. Simply Wall St provides detailed projections out to 2035, with the first five years based on analyst estimates and the later years extrapolated from those inputs.
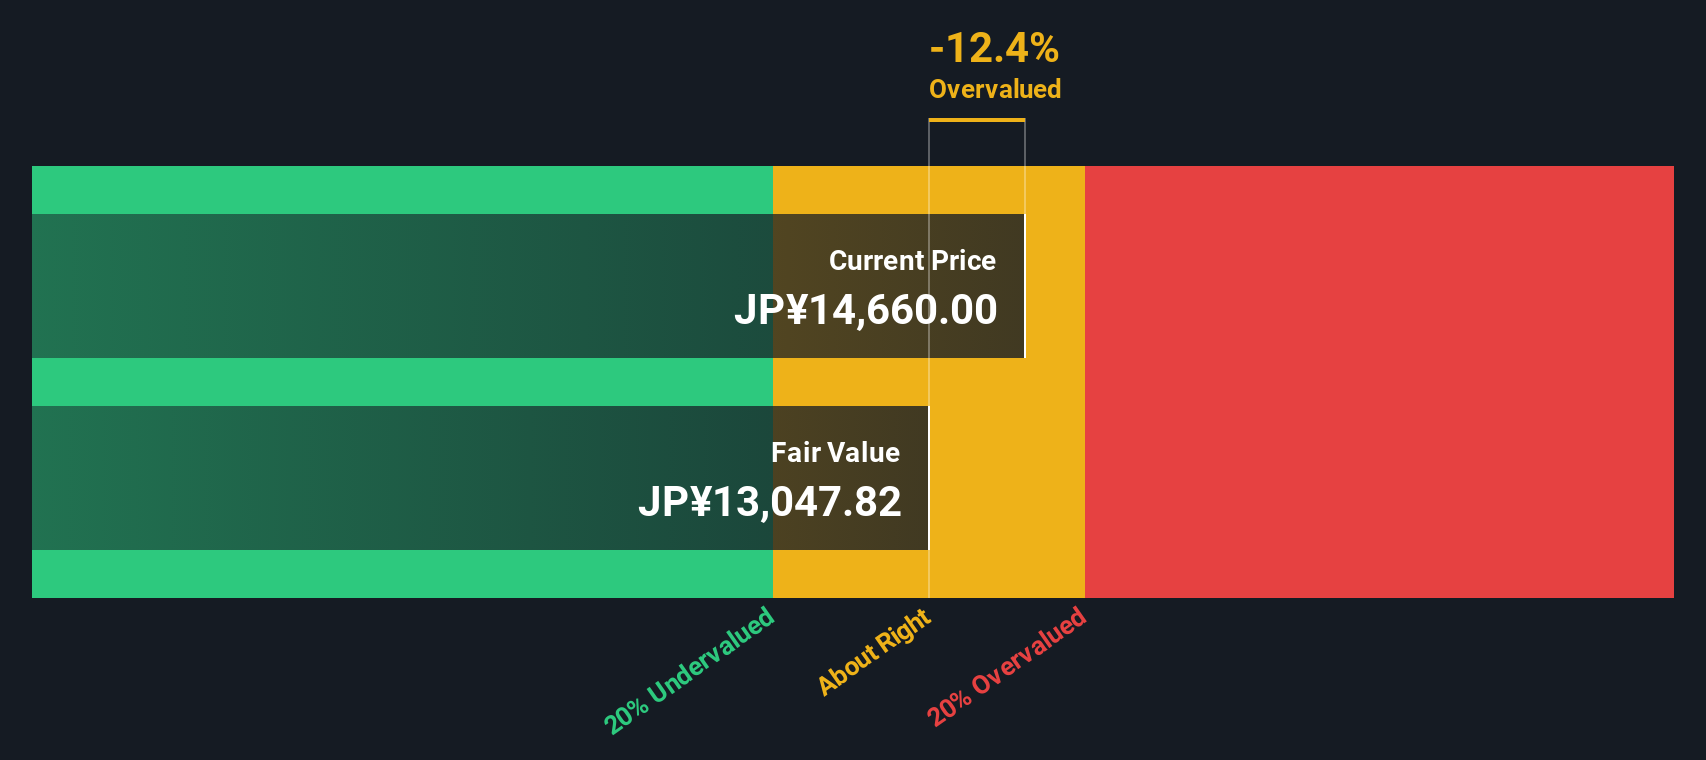
When those projected cash flows are discounted back to today, the model arrives at an intrinsic value of roughly ¥14,845 per share. Against the recent share price of ¥15,410, that implies the stock is about 3.8% over this DCF estimate, which sits in a fairly tight range around the market price.
Result: ABOUT RIGHT
SCREEN Holdings is fairly valued according to our Discounted Cash Flow (DCF), but this can change at a moment's notice. Track the value in your watchlist or portfolio and be alerted on when to act.
Approach 2: SCREEN Holdings Price vs Earnings
For a profitable company like SCREEN Holdings, the P/E ratio is a useful way to think about what you are paying for each unit of earnings. Investors usually accept a higher P/E when they expect stronger growth or see lower risk, and a lower P/E when they expect slower growth or higher risk, so there is no single “right” number.
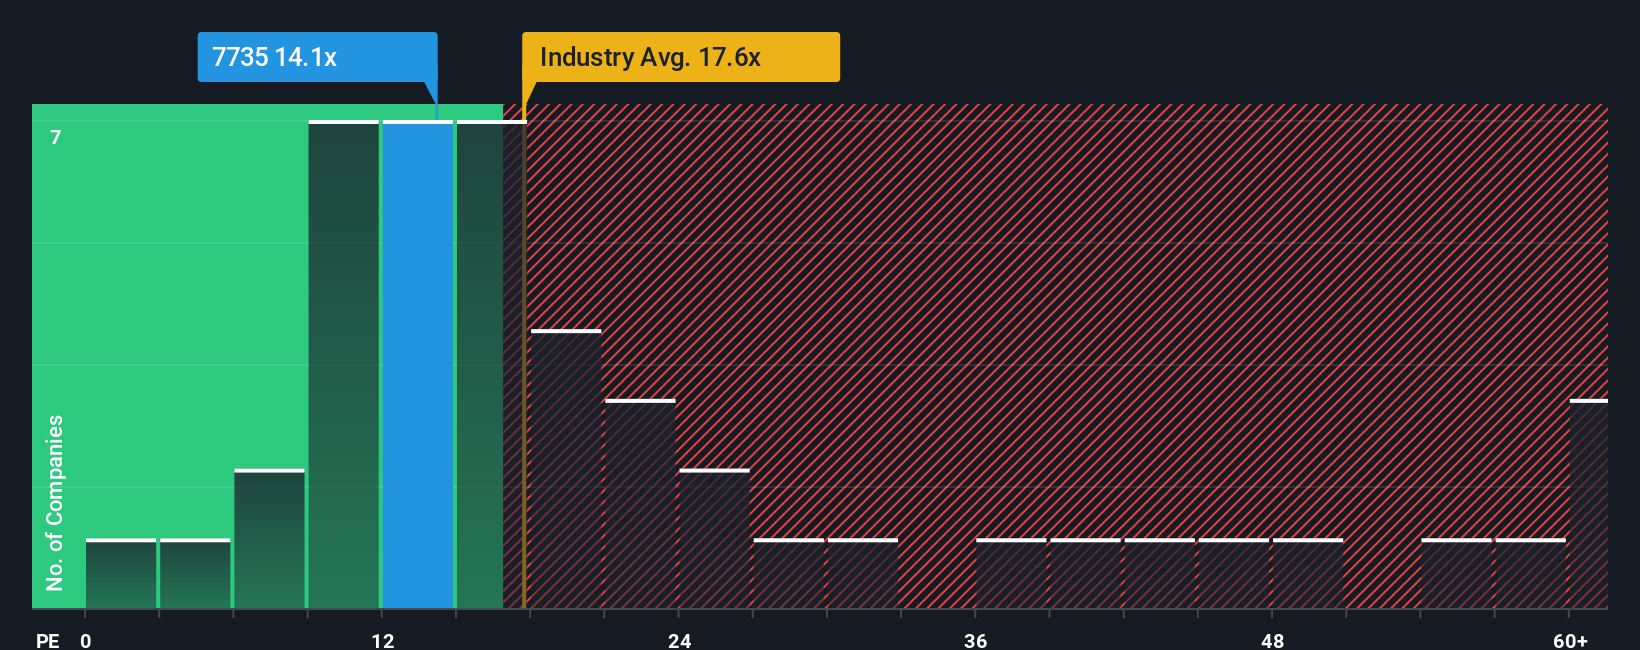
SCREEN Holdings currently trades on a P/E of 15.75x. That sits below the Semiconductor industry average of about 22.68x and well below the broader peer group average of 35.53x. This suggests the market is applying a more cautious multiple compared with many peers.
Simply Wall St’s Fair Ratio for SCREEN Holdings is 23.55x. This is a proprietary estimate of what the P/E might be given factors such as earnings growth, profit margins, industry, market cap and identified risks. Because it adjusts for these fundamentals rather than relying on simple peer or industry comparisons, it aims to be a more tailored benchmark.
Comparing the Fair Ratio of 23.55x with the actual P/E of 15.75x points to SCREEN Holdings trading below this model-based reference level.
Result: UNDERVALUED
P/E ratios tell one story, but what if the real opportunity lies elsewhere? Discover 1444 companies where insiders are betting big on explosive growth.
Upgrade Your Decision Making: Choose your SCREEN Holdings Narrative
Earlier we mentioned that there is an even better way to think about valuation. On Simply Wall St that comes through Narratives, where you outline your story for SCREEN Holdings, link that story to explicit forecasts for revenue, earnings and margins, and let the platform, within the Community page used by millions of investors, translate it into a fair value that you can easily compare to the current share price. This allows you to see if your view points you toward waiting, adding, or trimming, with the numbers updating automatically as fresh news or earnings arrive. For example, one investor might build a Narrative around the higher analyst price target of ¥17,800 and more optimistic assumptions about AI driven equipment demand. Another may anchor to the ¥11,500 low target with a more cautious view on China exposure and margin pressure, giving you a clear sense of where your own expectations sit on that spectrum.
Do you think there's more to the story for SCREEN Holdings? Head over to our Community to see what others are saying!
This article by Simply Wall St is general in nature. We provide commentary based on historical data and analyst forecasts only using an unbiased methodology and our articles are not intended to be financial advice. It does not constitute a recommendation to buy or sell any stock, and does not take account of your objectives, or your financial situation. We aim to bring you long-term focused analysis driven by fundamental data. Note that our analysis may not factor in the latest price-sensitive company announcements or qualitative material. Simply Wall St has no position in any stocks mentioned.
Have feedback on this article? Concerned about the content? Get in touch with us directly. Alternatively, email editorial-team@simplywallst.com