
Alphamab Oncology (SEHK:9966) Valuation Check After JSKN033 Phase II Trial Clearance In China
Regulatory milestone and why it matters for Alphamab Oncology
Alphamab Oncology (SEHK:9966) has drawn attention after regulators in China accepted its investigational new drug application for a phase II trial of JSKN033 in first line advanced cervical cancer.
The open label, multicenter study will test a high concentration subcutaneous co formulation. It combines a HER2 bispecific antibody drug conjugate with a PD L1 inhibitor, alongside platinum based chemotherapy with or without bevacizumab, in patients who have not previously received systemic treatment for advanced disease.
See our latest analysis for Alphamab Oncology.
The JSKN033 update comes after a strong short term run, with a 1 day share price return of 6.08% and a 7 day return of 10.41%, while the 90 day share price return of a 17.15% decline contrasts with a 1 year total shareholder return of 220.12%. This suggests momentum has recently picked up against a mixed longer track record.
If this kind of pipeline driven move has your attention, it could be a good moment to broaden your watchlist with healthcare stocks that are catching market interest too.
With the shares up 10.4% over 7 days but still showing a 17.2% 90 day decline, is Alphamab Oncology now trading below what its pipeline might justify, or is the market already pricing in future growth?
Price-to-Earnings of 40.3x: Is it justified?
On a P/E of 40.3x at a last close of HK$10.82, Alphamab Oncology screens as more expensive than the Asian biotech average, even though it sits below the peer group average highlighted in the data.
The P/E multiple compares the current share price to earnings per share, so for a company like Alphamab Oncology it reflects what investors are currently willing to pay for its profits. In biotech, higher P/E ratios are often associated with strong revenue growth expectations, pipeline progress and the potential for future cash flows that are not yet fully visible in current earnings.
Here, the company is described as expensive versus the broader Asian biotech industry on a P/E of 38.7x, yet it is considered good value against a peer average P/E of 61.5x. That mix suggests the market is already attaching a premium to Alphamab Oncology's earnings, while still not pricing it at the very top end of its closer comparison set.
Compared with the Asian biotech industry, Alphamab Oncology's 40.3x P/E is framed as high, which points to investors paying more per unit of earnings than the sector average. At the same time, being below the 61.5x peer average P/E means the stock trades at a discount to some closer comparables. This implies the multiple could be seen as either a premium to the wider sector or a relative discount within a narrower peer group, depending on which reference point is used.
See what the numbers say about this price — find out in our valuation breakdown.
Result: Price-to-Earnings of 40.3x (ABOUT RIGHT)
However, you still have to weigh risks such as the 17.2% 90 day share price decline and the stock trading above the HK$6.999936 analyst target.
Find out about the key risks to this Alphamab Oncology narrative.
Another view: DCF points in a different direction
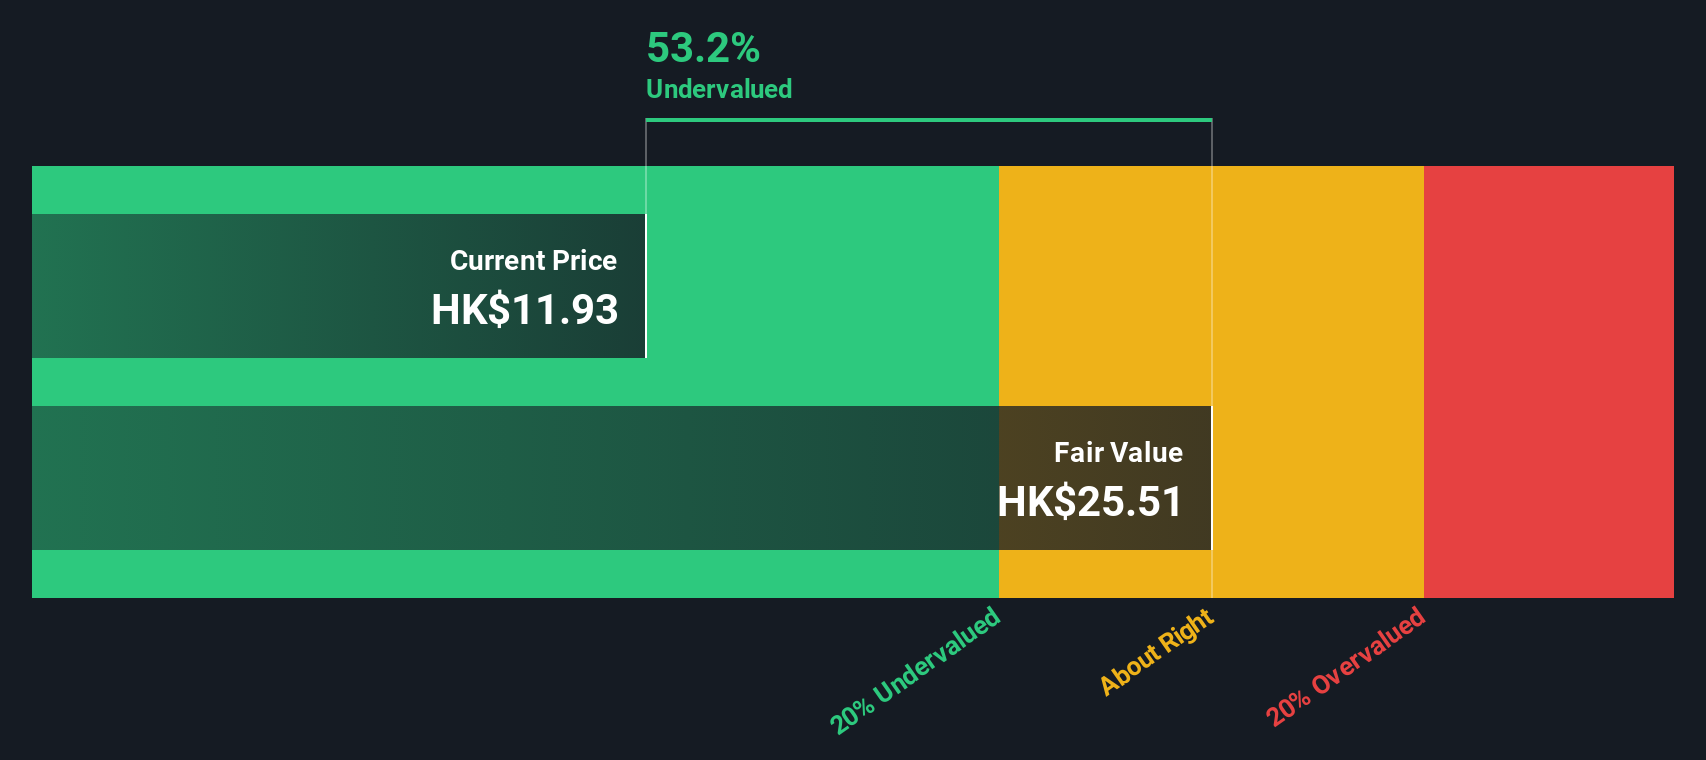
While the 40.3x P/E makes Alphamab Oncology look expensive compared with the 38.7x Asian biotech average, our DCF model suggests a different story. With the shares at HK$10.82 versus an estimated fair value of HK$25.95, the stock is described as trading 58.3% below that fair value.
That kind of gap can either signal an opportunity if the assumptions hold up, or a warning that the cash flow outlook is harder to achieve than it looks on paper. The key question is which signal you trust more: the earnings multiple or the cash flow model?
Look into how the SWS DCF model arrives at its fair value.
Simply Wall St performs a discounted cash flow (DCF) on every stock in the world every day (check out Alphamab Oncology for example). We show the entire calculation in full. You can track the result in your watchlist or portfolio and be alerted when this changes, or use our stock screener to discover 880 undervalued stocks based on their cash flows. If you save a screener we even alert you when new companies match - so you never miss a potential opportunity.
Build Your Own Alphamab Oncology Narrative
If you see the numbers differently or prefer to base decisions on your own view of the data, you can build a custom thesis in minutes with Do it your way
A good starting point is our analysis highlighting 3 key rewards investors are optimistic about regarding Alphamab Oncology.
Looking for more investment ideas?
If Alphamab Oncology has sharpened your interest, do not stop here, the same tools can help you spot other focused ideas that fit your style.
- Target potential mispricing by scanning these 880 undervalued stocks based on cash flows that may offer more earnings for every dollar you commit.
- Ride major tech shifts early by checking out these 27 AI penny stocks that are tying artificial intelligence to real business models.
- Strengthen your passive income plan by reviewing these 12 dividend stocks with yields > 3% that already offer yields above 3%.
This article by Simply Wall St is general in nature. We provide commentary based on historical data and analyst forecasts only using an unbiased methodology and our articles are not intended to be financial advice. It does not constitute a recommendation to buy or sell any stock, and does not take account of your objectives, or your financial situation. We aim to bring you long-term focused analysis driven by fundamental data. Note that our analysis may not factor in the latest price-sensitive company announcements or qualitative material. Simply Wall St has no position in any stocks mentioned.
Have feedback on this article? Concerned about the content? Get in touch with us directly. Alternatively, email editorial-team@simplywallst.com