
Is Chewy (CHWY) Now Offering Value After Prolonged Share Price Weakness
- If you are wondering whether Chewy’s current share price reflects its real worth, you are not alone. This article is designed to help you think that through clearly.
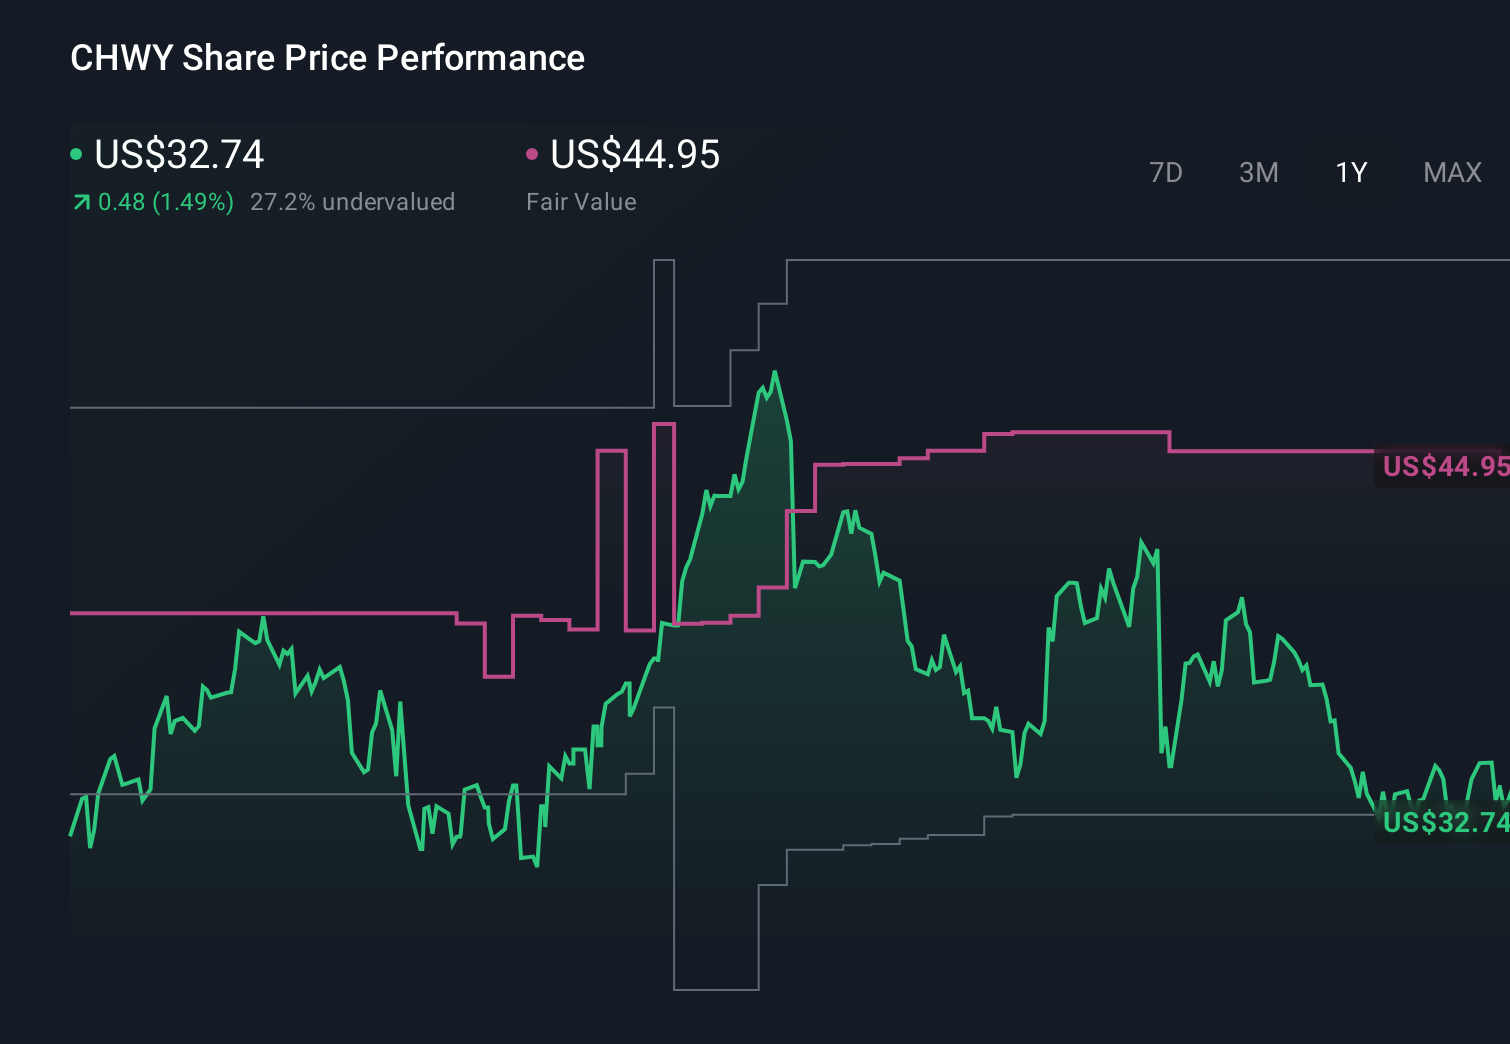
- Chewy most recently closed at US$32.00, after share price returns of a 3.2% decline over 7 days, a 7.6% decline over 30 days, a 4.4% decline year to date, an 11.6% decline over 1 year, a 26.9% decline over 3 years and a 71.5% decline over 5 years.
- These moves sit against a backdrop of ongoing attention on Chewy’s role in the US pet retail market and its online subscription based model for pet supplies. News coverage has often focused on how investor expectations line up with the company’s long term growth plans and competitive position.
- Right now, Chewy scores 3 out of 6 on our valuation checks. You can see that breakdown in our valuation score. We will unpack this using a few common valuation approaches before finishing with a more complete way to think about what this stock could be worth.
Find out why Chewy's -11.6% return over the last year is lagging behind its peers.
Approach 1: Chewy Discounted Cash Flow (DCF) Analysis
A Discounted Cash Flow, or DCF, model estimates what a company could be worth by projecting its future cash flows and discounting them back to today’s value. It is essentially asking what those future dollars are worth in today’s terms.
For Chewy, the model used is a 2 Stage Free Cash Flow to Equity approach. The company’s last twelve months Free Cash Flow is about $476.8 million. Analyst projections and subsequent extrapolations in this model have Free Cash Flow reaching about $1.24 billion by 2030, with intermediate annual projections between 2026 and 2035 ranging from roughly $581.2 million to $1.84 billion, all expressed in today’s dollars once discounted.
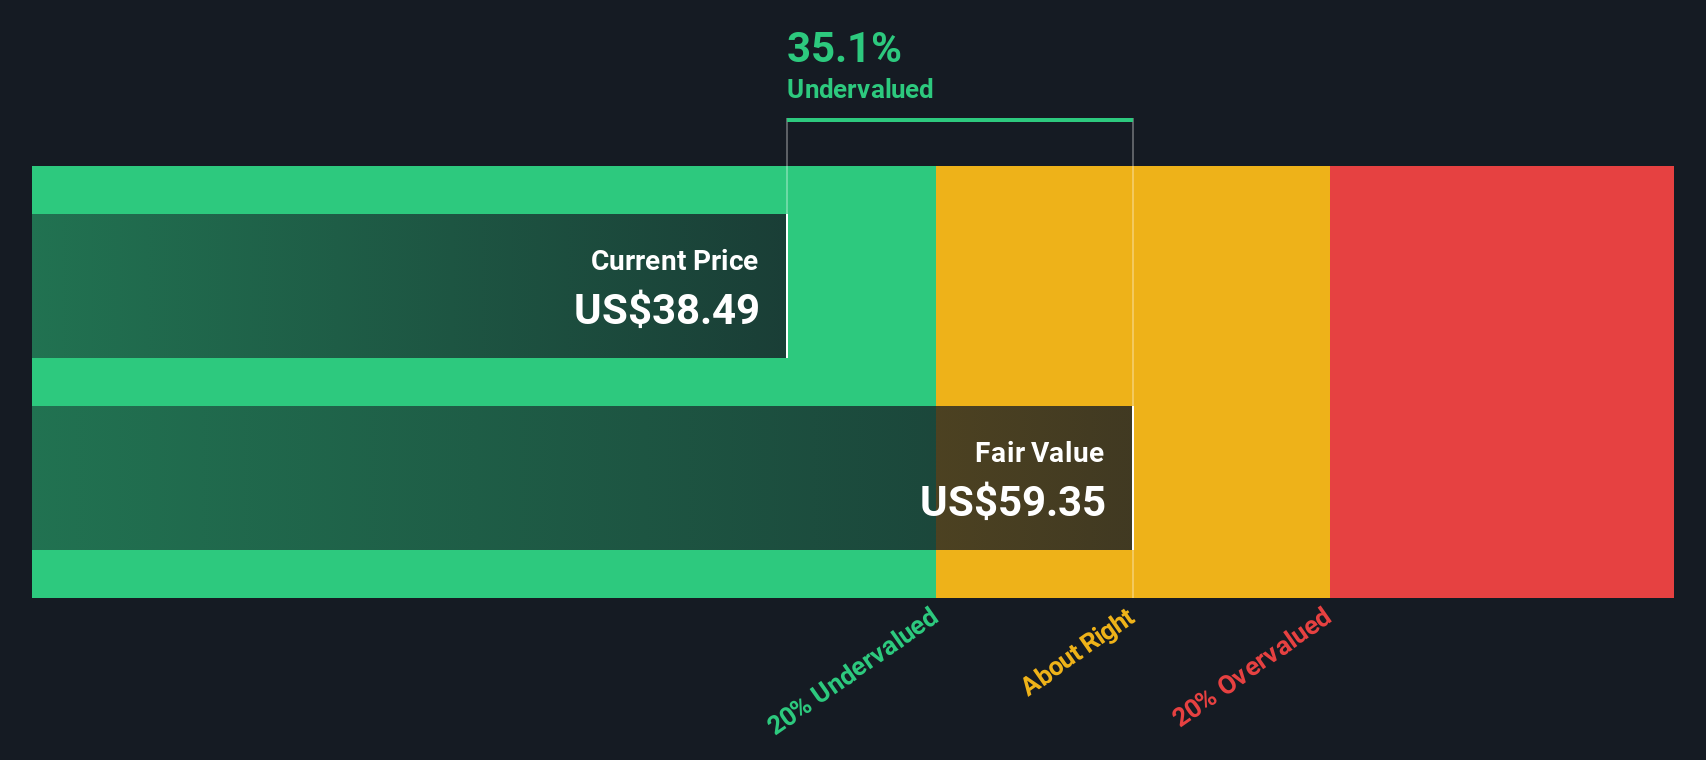
Using these cash flow projections, this DCF model arrives at an estimated intrinsic value of US$57.01 per share. Compared with the recent share price of US$32.00, this framework suggests Chewy is trading at about a 43.9% discount to the modelled value on this measure.
Result: UNDERVALUED (on this DCF model)
Our Discounted Cash Flow (DCF) analysis suggests Chewy is undervalued by 43.9%. Track this in your watchlist or portfolio, or discover 879 more undervalued stocks based on cash flows.
Approach 2: Chewy Price vs Earnings
For companies that are generating profits, the P/E ratio is a useful way to connect what you pay for each share with the earnings that support it. You can think of it as the price tag on every dollar of current earnings, which gives a quick sense of how the market is weighing those profits.
What counts as a normal or fair P/E depends a lot on how quickly earnings are expected to grow and how risky those earnings are. Higher growth or lower perceived risk can justify a higher multiple, while slower growth or higher risk can point to a lower one.
Chewy currently trades on a P/E of 64.33x. That sits well above the Specialty Retail industry average of 20.25x and also above the peer group average of 25.68x. Simply Wall St’s Fair Ratio for Chewy is 28.43x, which is its proprietary view of what a reasonable P/E could be once you factor in elements like earnings growth, profit margins, industry, market cap and specific risks.
The Fair Ratio is more tailored than a simple peer or industry comparison because it adjusts for those company specific drivers rather than assuming all retailers deserve similar multiples. Lining up 64.33x against the 28.43x Fair Ratio suggests Chewy’s shares are pricing in more optimistic conditions than this framework would support.
Result: OVERVALUED

P/E ratios tell one story, but what if the real opportunity lies elsewhere? Discover 1443 companies where insiders are betting big on explosive growth.
Upgrade Your Decision Making: Choose your Chewy Narrative
Earlier we mentioned that there is an even better way to understand valuation. Let us introduce you to Narratives, which are simple stories you build around a company like Chewy. Narratives connect your view of its future revenue, earnings and margins to a forecast and then to a fair value. All of this happens within Simply Wall St’s Community page, where millions of investors share their perspectives, compare that fair value to the current share price to help decide whether they see a buy or sell opportunity, and see those Narratives update automatically when fresh news or earnings arrive. One investor might plug in assumptions that support a Chewy fair value closer to the higher end of analyst targets at US$52.00, while another might lean toward the more cautious US$33.00 view. Both can instantly see how their story translates into numbers and a valuation they can act on.
Do you think there's more to the story for Chewy? Head over to our Community to see what others are saying!
This article by Simply Wall St is general in nature. We provide commentary based on historical data and analyst forecasts only using an unbiased methodology and our articles are not intended to be financial advice. It does not constitute a recommendation to buy or sell any stock, and does not take account of your objectives, or your financial situation. We aim to bring you long-term focused analysis driven by fundamental data. Note that our analysis may not factor in the latest price-sensitive company announcements or qualitative material. Simply Wall St has no position in any stocks mentioned.
Have feedback on this article? Concerned about the content? Get in touch with us directly. Alternatively, email editorial-team@simplywallst.com