
Hanwa (TSE:8078) Valuation Check After Ongoing Share Buyback Activity
Hanwa’s latest share buyback activity
Hanwa (TSE:8078) recently reported progress on its ongoing share repurchase, completing the buyback of 284,100 shares, or 0.72% of outstanding stock, for ¥1,950.18 million under its November 2025 authorization.
See our latest analysis for Hanwa.
Hanwa’s recent buyback news comes after a period of firm share price momentum, with a 90 day share price return of 18.73% and a 1 year total shareholder return of 61.95%. This suggests investors are rewarding the company’s recent execution and capital allocation.
If Hanwa’s move has you thinking about where else strong sentiment might be building, this could be a good moment to broaden your search with fast growing stocks with high insider ownership.
With the buyback underway, a value score of 5, an intrinsic value estimate suggesting roughly a 22% discount, and a share price above the average analyst target, the key question is whether Hanwa is undervalued or whether the market is already pricing in future growth.
Price-to-Earnings of 7x: Is it justified?
Hanwa is trading on a P/E of 7x, and at ¥7,480 this lines up with multiple checks suggesting the market price is below several value benchmarks.
The P/E ratio compares the current share price with the company’s earnings per share, so it broadly reflects what investors are willing to pay for each unit of profit. For a diversified trading and materials group like Hanwa, P/E is a common yardstick because earnings and cash generation are central to how investors think about return potential.
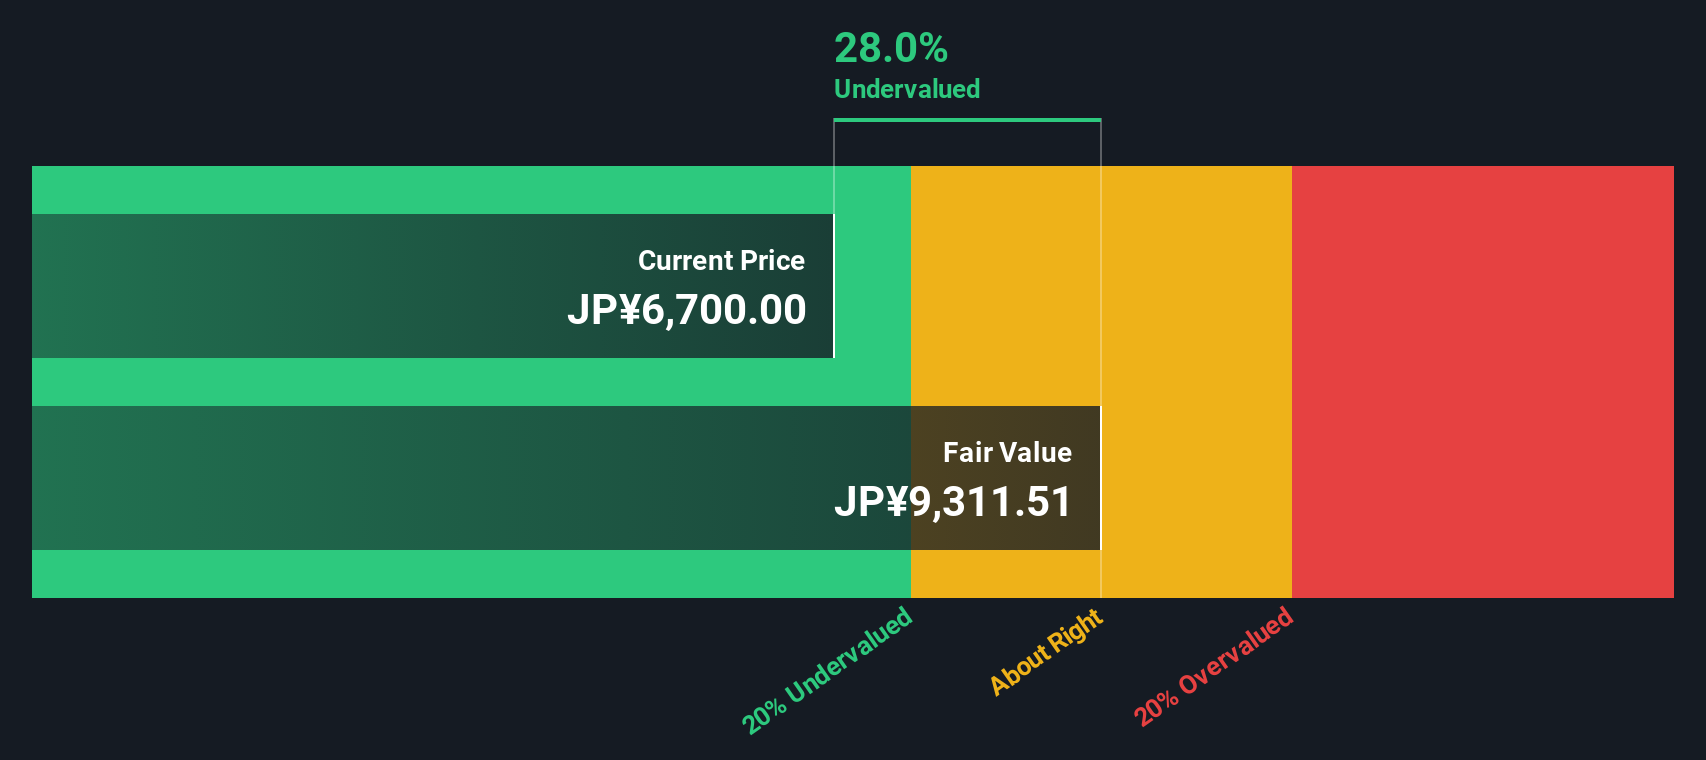
On Simply Wall St’s checks, Hanwa screens as good value against an estimated fair P/E of 14x, implying the current 7x multiple sits well under a level the market could potentially move toward if sentiment and expectations align. It also screens as good value on a discounted cash flow basis, with the SWS DCF model estimating fair value at ¥9,575.69 compared with the current ¥7,480 share price.
Relative to peers, the contrast is even clearer. Hanwa’s 7x P/E is below the peer average of 12.8x and the broader JP Trade Distributors industry average of 10.7x, pointing to a materially lower earnings multiple than many similar companies.
Explore the SWS fair ratio for Hanwa
Result: Price-to-Earnings of 7x (UNDERVALUED)
However, you also need to weigh risks like Hanwa’s relatively low analyst price target of ¥6,333, as well as the cyclical exposure that comes with broad materials and energy trading.
Find out about the key risks to this Hanwa narrative.
Another view on value
The SWS DCF model backs up the P/E story, indicating Hanwa’s shares trade at roughly a 22% discount to its estimated fair value of ¥9,575.69 versus the current ¥7,480. Two methods pointing to undervaluation can look reassuring, but do they both rest on assumptions you are comfortable with?
Look into how the SWS DCF model arrives at its fair value.
Simply Wall St performs a discounted cash flow (DCF) on every stock in the world every day (check out Hanwa for example). We show the entire calculation in full. You can track the result in your watchlist or portfolio and be alerted when this changes, or use our stock screener to discover 883 undervalued stocks based on their cash flows. If you save a screener we even alert you when new companies match - so you never miss a potential opportunity.
Build Your Own Hanwa Narrative
If you see the numbers differently or prefer to build your own view from the ground up, you can test the data yourself in minutes, then Do it your way.
A great starting point for your Hanwa research is our analysis highlighting 4 key rewards and 2 important warning signs that could impact your investment decision.
Looking for more investment ideas?
If you are serious about tightening up your portfolio and spotting fresh opportunities, do not stop at Hanwa. Broaden your search with targeted stock screens.
- Spot potential value candidates early by scanning these 883 undervalued stocks based on cash flows, which is built around cash flow based opportunities that might not be on everyone’s radar yet.
- Tap into powerful tech themes by checking out these 27 AI penny stocks, where companies are working with artificial intelligence across different parts of the economy.
- Explore the next payment and blockchain trends using these 79 cryptocurrency and blockchain stocks, which focuses on businesses tied to digital assets and distributed ledger technology.
This article by Simply Wall St is general in nature. We provide commentary based on historical data and analyst forecasts only using an unbiased methodology and our articles are not intended to be financial advice. It does not constitute a recommendation to buy or sell any stock, and does not take account of your objectives, or your financial situation. We aim to bring you long-term focused analysis driven by fundamental data. Note that our analysis may not factor in the latest price-sensitive company announcements or qualitative material. Simply Wall St has no position in any stocks mentioned.
Have feedback on this article? Concerned about the content? Get in touch with us directly. Alternatively, email editorial-team@simplywallst.com