
Is Huntington Bancshares (HBAN) Still Attractive After Recent Regional Banking Sector Headlines?
- If you are wondering whether Huntington Bancshares' current share price still offers value, you are not alone. This article walks through what the numbers say about that question.
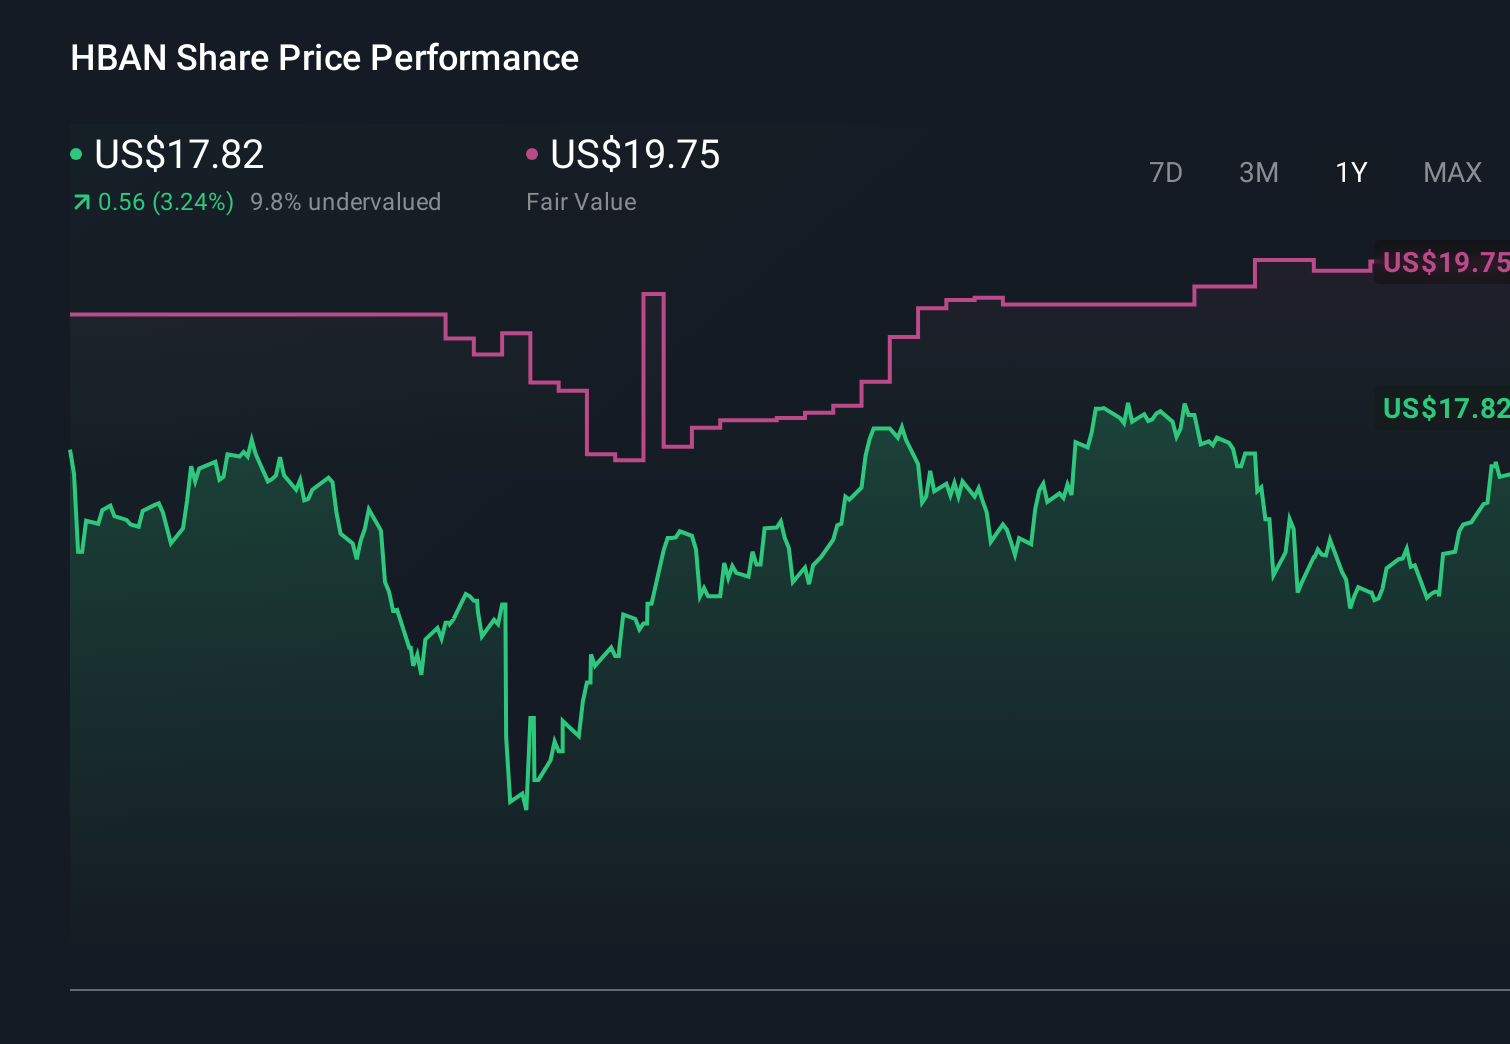
- With the stock at US$18.14 and returns of 4.6% over 7 days, 7.1% over 30 days, 3.8% year to date, 14.7% over 1 year, 42.8% over 3 years and 52.3% over 5 years, many investors are asking what is already priced in.
- Recent headlines around Huntington Bancshares have focused on the broader US regional banking sector, including ongoing discussion about credit quality, deposit trends and how higher for longer interest rates affect margins. These themes help frame market expectations around risk and reward for the stock and provide context for its recent share price moves.
- On our checks, Huntington Bancshares scores 3 out of 6 for potential undervaluation. Next we will look at how common valuation tools like P/E, P/B and cash flow models line up, before finishing with a way to think about value that goes beyond any single metric.
Find out why Huntington Bancshares's 14.7% return over the last year is lagging behind its peers.
Approach 1: Huntington Bancshares Excess Returns Analysis
The Excess Returns model looks at how much profit a company can generate above the return that shareholders are assumed to require, then capitalizes those “excess” profits into an estimated value per share.
For Huntington Bancshares, the model starts with a Book Value of $13.37 per share and a Stable EPS of $1.96 per share, based on weighted future Return on Equity estimates from 11 analysts. The Cost of Equity is $1.14 per share, which implies an Excess Return of $0.82 per share, or earnings above what investors are assumed to require for the risk they are taking.
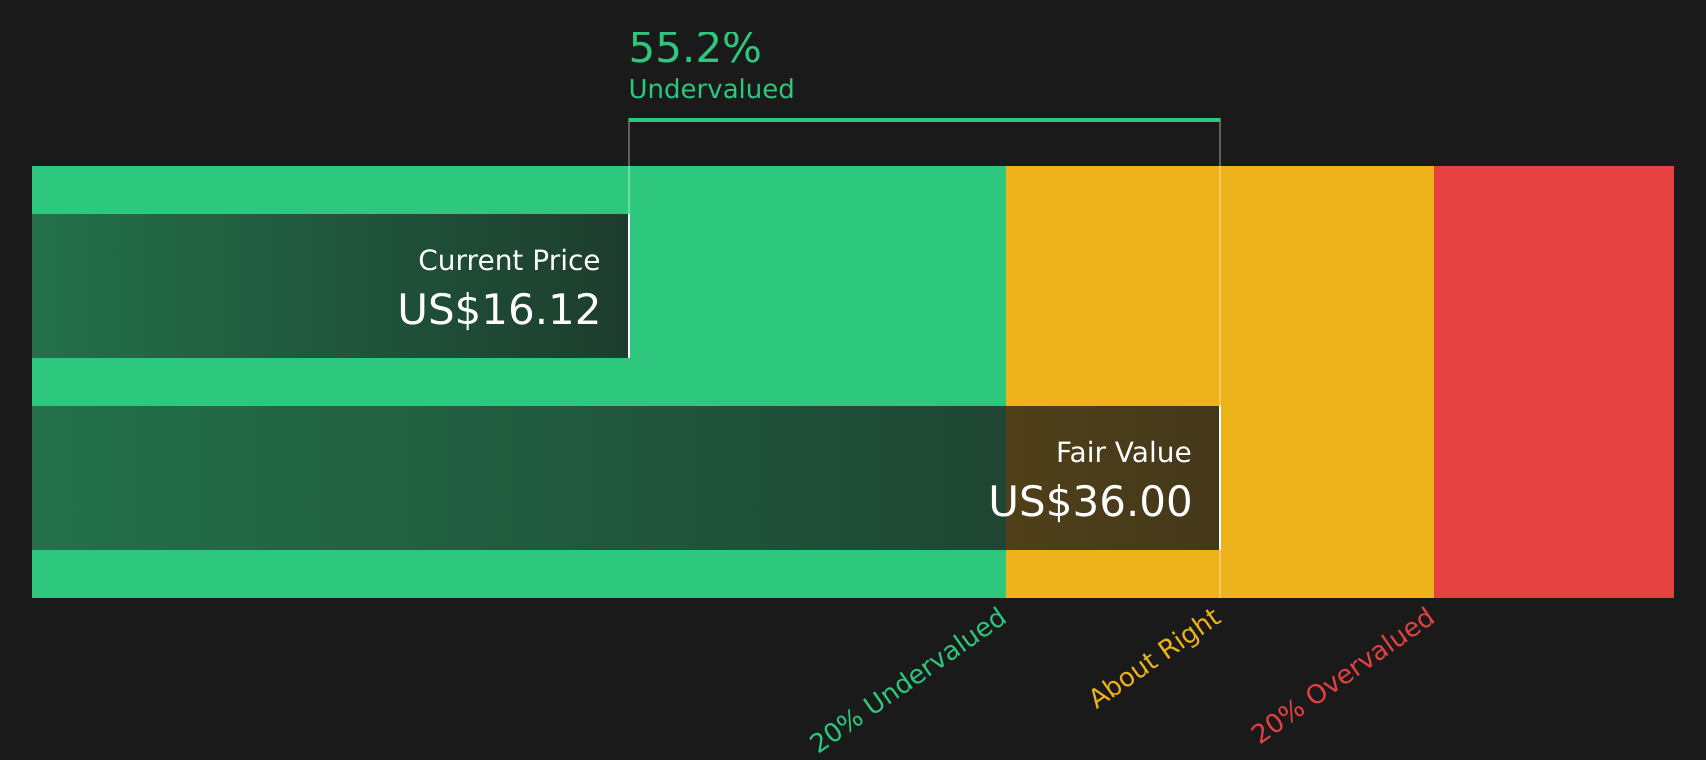
The Average Return on Equity used in the model is 12.55%, and the Stable Book Value is set at $15.63 per share, sourced from weighted future Book Value estimates from 10 analysts. Using these inputs, the Excess Returns framework produces an intrinsic value estimate of US$36.10 per share. Compared with the current price of US$18.14, this implies the shares are trading at a discount of about 49.7% to the intrinsic value estimate.
Result: UNDERVALUED
Our Excess Returns analysis suggests Huntington Bancshares is undervalued by 49.7%. Track this in your watchlist or portfolio, or discover 883 more undervalued stocks based on cash flows.
Approach 2: Huntington Bancshares Price vs Earnings
For a profitable bank like Huntington Bancshares, the P/E ratio is a useful shorthand for what investors are currently paying for each dollar of earnings. It is simple to compare across time and against other banks, which makes it a common anchor when you are sanity checking a share price.
What counts as a “normal” or “fair” P/E depends on how the market views a company’s earnings outlook and risk profile. Higher expected growth or lower perceived risk can justify a higher P/E, while slower growth or higher risk usually go with a lower multiple.
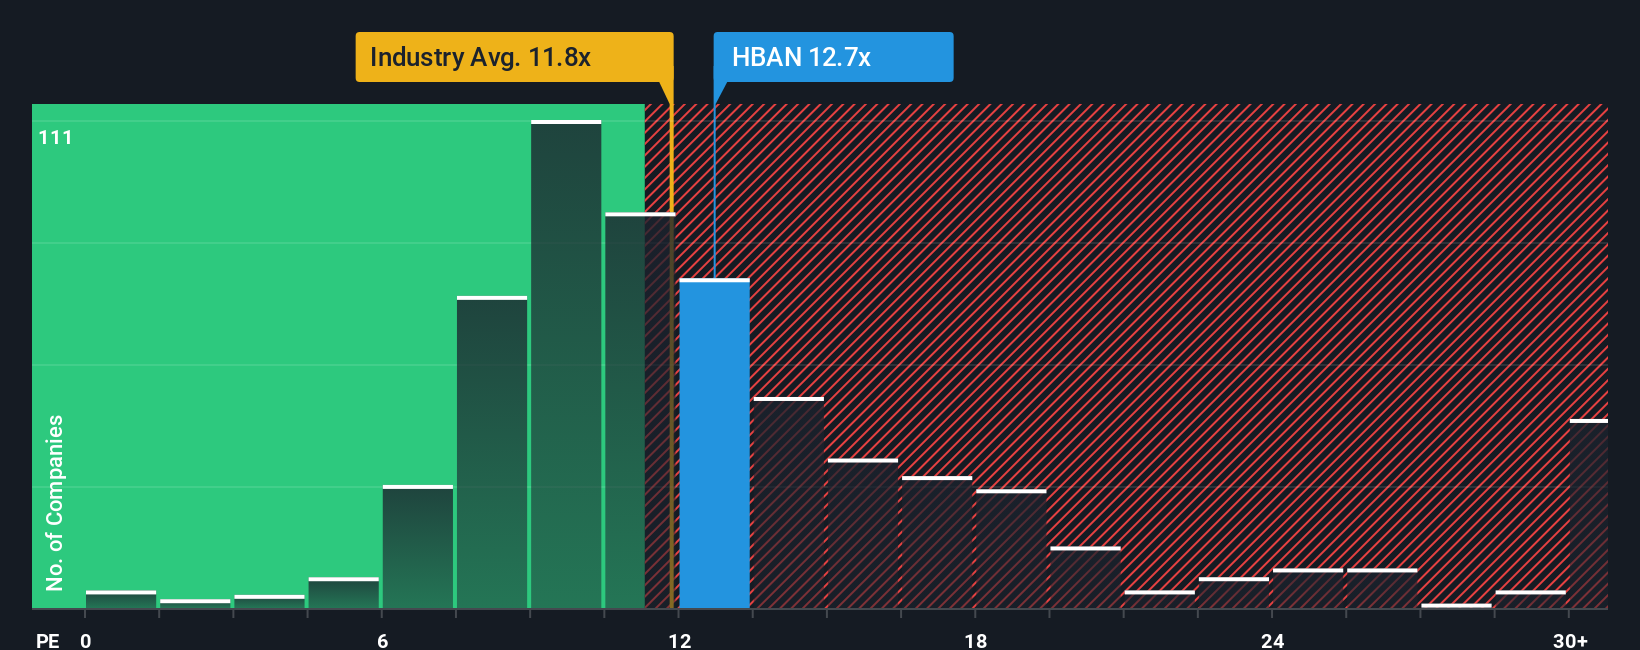
Huntington Bancshares currently trades on a P/E of 13.49x. That is close to both the peer average of 13.46x and above the broader Banks industry average of 11.87x. Simply Wall St’s Fair Ratio for Huntington Bancshares is 17.49x. This Fair Ratio is a proprietary estimate of what the P/E “should” be, based on factors such as the company’s earnings growth profile, profit margins, risk indicators, industry and market cap. Because it adjusts for these company specific drivers, it can be more tailored than a simple comparison with peers or the sector average. On this basis, Huntington Bancshares’ current P/E of 13.49x is below the Fair Ratio of 17.49x, which indicates that the shares screen as undervalued on this measure.
Result: UNDERVALUED
P/E ratios tell one story, but what if the real opportunity lies elsewhere? Discover 1446 companies where insiders are betting big on explosive growth.
Upgrade Your Decision Making: Choose your Huntington Bancshares Narrative
Earlier we mentioned that there is an even better way to understand valuation. On Simply Wall St’s Community page you can use Narratives to link your view of Huntington Bancshares’ story to a financial forecast and fair value. You can set your own assumptions for future revenue, earnings and margins, let the tool compare your Fair Value to the current price, and then update that view automatically as new news or earnings arrive. One investor might focus on expansion, digital investment and the consensus fair value of about US$20.18 per share and see more upside. Another might focus on integration, credit and regulatory risks, lean toward the more cautious analyst target of US$15.40, and reach a very different conclusion about whether the current price looks attractive or not.
Do you think there's more to the story for Huntington Bancshares? Head over to our Community to see what others are saying!
This article by Simply Wall St is general in nature. We provide commentary based on historical data and analyst forecasts only using an unbiased methodology and our articles are not intended to be financial advice. It does not constitute a recommendation to buy or sell any stock, and does not take account of your objectives, or your financial situation. We aim to bring you long-term focused analysis driven by fundamental data. Note that our analysis may not factor in the latest price-sensitive company announcements or qualitative material. Simply Wall St has no position in any stocks mentioned.
Have feedback on this article? Concerned about the content? Get in touch with us directly. Alternatively, email editorial-team@simplywallst.com