
Is It Too Late To Consider Cencora (COR) After A 236% Five Year Run?
- If you are wondering whether Cencora’s share price still offers value after a strong run, this article walks through what the numbers actually say about the stock.
- The share price sits at US$335.74, with returns of 42.3% over 1 year, 109.3% over 3 years and 235.9% over 5 years, even though the stock has seen small pullbacks of 0.6% over the last week and 0.5% over the last month, and a 0.9% decline year to date.
- Recent coverage has focused on Cencora’s role as a large healthcare distributor and on how investors are thinking about its position in the wider US healthcare sector. This context helps explain why the share price performance over the last few years has attracted extra attention from investors assessing risk and return.
- Cencora currently has a valuation score of 2 out of 6, based on how many checks suggest the stock may be undervalued. We will look at how methods like DCF, P/E and peer comparisons line up on that score, before touching on an even more useful way to think about valuation at the end of the article.
Cencora scores just 2/6 on our valuation checks. See what other red flags we found in the full valuation breakdown.
Approach 1: Cencora Discounted Cash Flow (DCF) Analysis
A Discounted Cash Flow model takes estimates of the cash a business could generate in the future and discounts those amounts back to today to arrive at an estimate of what the entire company might be worth right now.
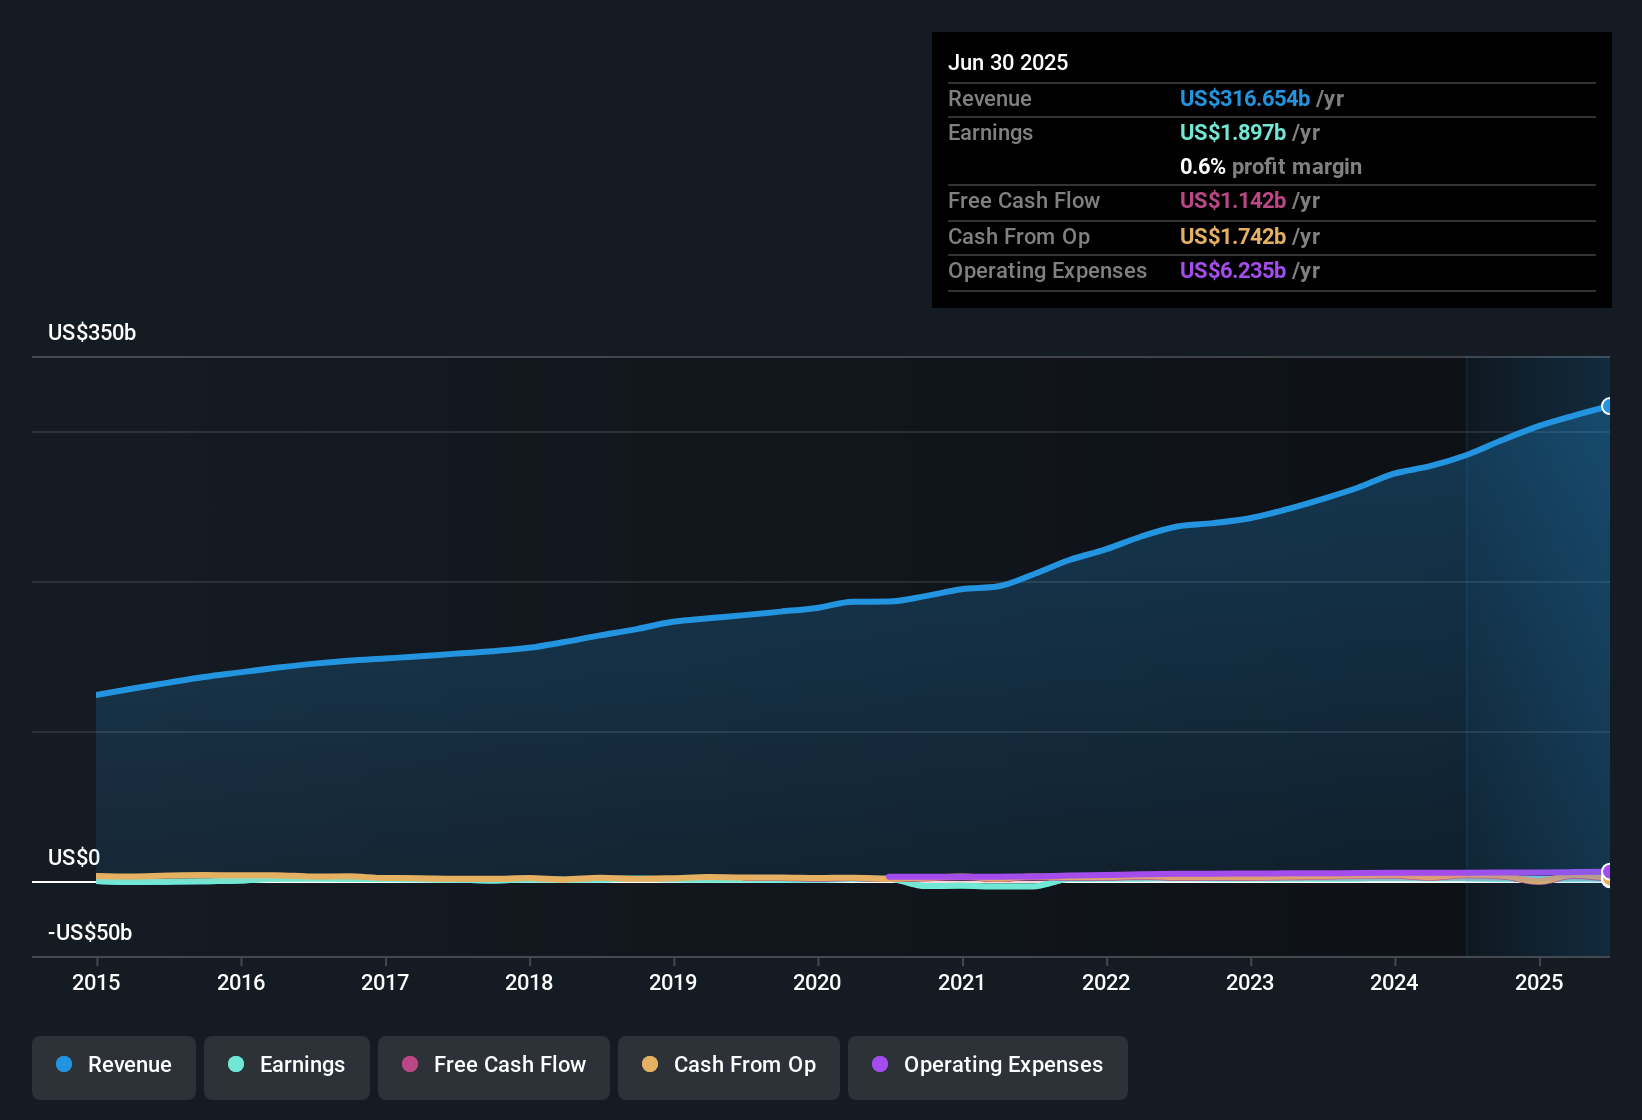
For Cencora, the model used is a 2 Stage Free Cash Flow to Equity approach built on cash flow projections. The latest twelve month free cash flow is about $3.28b. Analyst estimates and subsequent extrapolations point to projected free cash flow of around $5.52b by 2030, with interim years between 2026 and 2035 supported by a mix of analyst forecasts and Simply Wall St extrapolations.
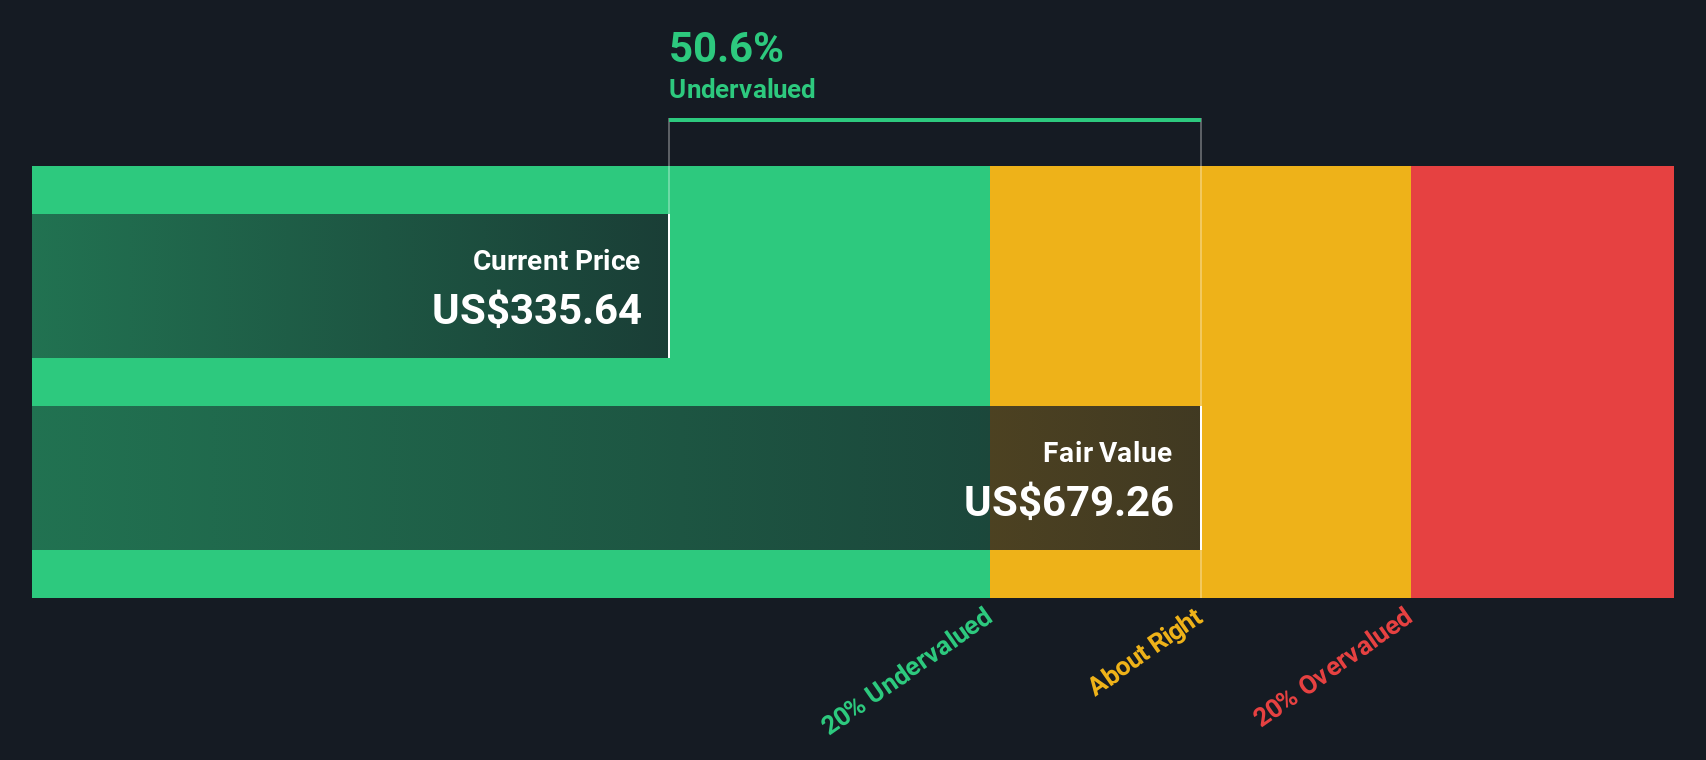
When all those projected cash flows are discounted back and added up, the model arrives at an estimated intrinsic value of about $694.01 per share. Against the current share price of $335.74, this implies an intrinsic discount of 51.6%, which indicates that Cencora may be trading well below the value implied by this cash flow based model.
Result: UNDERVALUED
Our Discounted Cash Flow (DCF) analysis suggests Cencora is undervalued by 51.6%. Track this in your watchlist or portfolio, or discover 880 more undervalued stocks based on cash flows.
Approach 2: Cencora Price vs Earnings
For profitable companies, the P/E ratio is a useful way to think about what you are paying for each dollar of earnings, because it links the share price directly to the underlying profit the business is generating today.
What counts as a “normal” P/E depends on how the market views the company’s growth potential and risk. Higher expected growth or perceived resilience can justify a higher P/E, while more uncertainty or weaker growth expectations tend to align with a lower P/E.
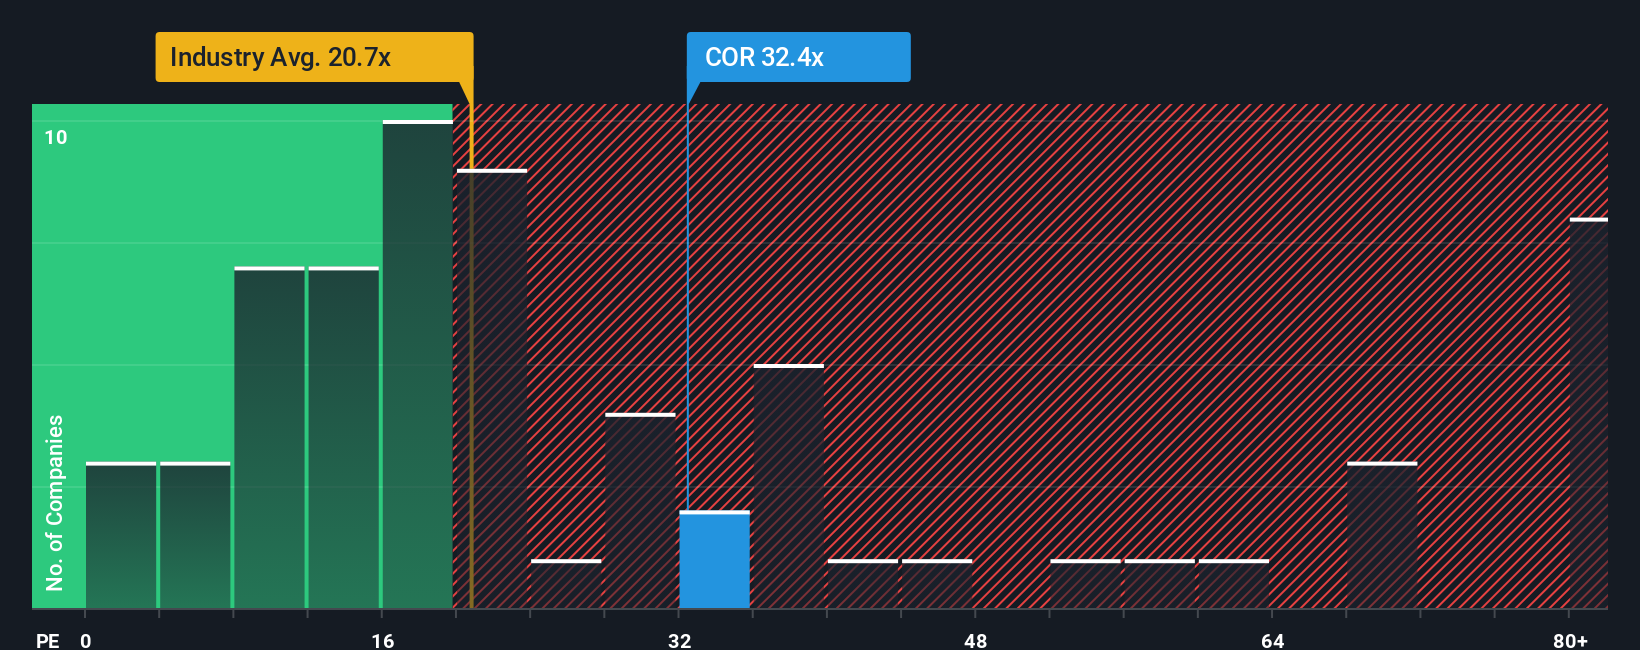
Cencora is currently trading on a P/E of 41.91x. That compares with an average P/E of 22.80x for its peer group and 22.88x for the broader Healthcare industry. Simply Wall St also calculates a “Fair Ratio” of 36.78x for Cencora, which is the P/E level suggested by factors such as its earnings growth profile, industry, profit margins, market cap and risk characteristics.
This Fair Ratio aims to be more tailored than a simple peer or industry comparison, because it adjusts for company specific features rather than assuming one size fits all. With the current P/E of 41.91x sitting above the Fair Ratio of 36.78x, the P/E approach suggests Cencora looks overvalued on this metric.
Result: OVERVALUED
P/E ratios tell one story, but what if the real opportunity lies elsewhere? Discover 1446 companies where insiders are betting big on explosive growth.
Upgrade Your Decision Making: Choose your Cencora Narrative
Earlier we mentioned that there is an even better way to understand valuation. Narratives let you attach a clear story about Cencora to numbers such as your fair value, and your expectations for future revenue, earnings and margins. This means that your view is not just a P/E or DCF output but a joined up picture that starts with the company’s business drivers, flows into a forecast, and lands in a fair value that you can easily compare with today’s share price on Simply Wall St’s Community page. Narratives are available to millions of investors, refresh automatically when new news or earnings arrive, and can differ widely. For example, one investor might agree with analysts that Cencora’s fair value is around US$386.60 per share, while another investor might lean closer to the lower US$274.00 view. This gives you a practical way to decide whether the current US$335.74 price lines up with your own story for the company.
Do you think there's more to the story for Cencora? Head over to our Community to see what others are saying!
This article by Simply Wall St is general in nature. We provide commentary based on historical data and analyst forecasts only using an unbiased methodology and our articles are not intended to be financial advice. It does not constitute a recommendation to buy or sell any stock, and does not take account of your objectives, or your financial situation. We aim to bring you long-term focused analysis driven by fundamental data. Note that our analysis may not factor in the latest price-sensitive company announcements or qualitative material. Simply Wall St has no position in any stocks mentioned.
Have feedback on this article? Concerned about the content? Get in touch with us directly. Alternatively, email editorial-team@simplywallst.com