
Is PotlatchDeltic (PCH) Pricing Reflect Its Cash Flow Outlook And Planned Rayonier Merger
- If you are wondering whether PotlatchDeltic at around US$43.12 is a fair deal or not, this article will walk through what the current price might be implying about value.
- The stock has seen returns of 8.6% over the last week, 5.5% over the last month, 8.6% year to date, 17.4% over 1 year, 10.0% over 3 years and 13.1% over 5 years. These figures may have caught the eye of investors thinking about growth potential or shifting risk.
- Recent coverage has focused on PotlatchDeltic as a US-listed real estate company in the timber and forestry space. This segment often draws attention when investors reassess asset-backed names. That context helps explain why some investors are taking a closer look at how its share price lines up with the underlying business.
- On our checks, PotlatchDeltic has a valuation score of 2 out of 6, meaning it screens as undervalued on 2 of 6 valuation tests. Next we will look at the key approaches behind that score before finishing with a way to judge value that goes a step further than the usual ratios.
PotlatchDeltic scores just 2/6 on our valuation checks. See what other red flags we found in the full valuation breakdown.
Approach 1: PotlatchDeltic Discounted Cash Flow (DCF) Analysis
A Discounted Cash Flow model takes estimates of a company’s future funds from operations, then discounts those cash flows back to today to arrive at an implied value per share.
For PotlatchDeltic, the model used is a 2 stage Free Cash Flow to Equity approach based on funds from operations. The latest twelve month free cash flow stands at $201.118 million. Analyst input is provided out to 2028, with projected free cash flow of $284.7 million in that year, and Simply Wall St extrapolates additional annual figures out to 2035 using gradual growth assumptions applied to those analyst estimates.
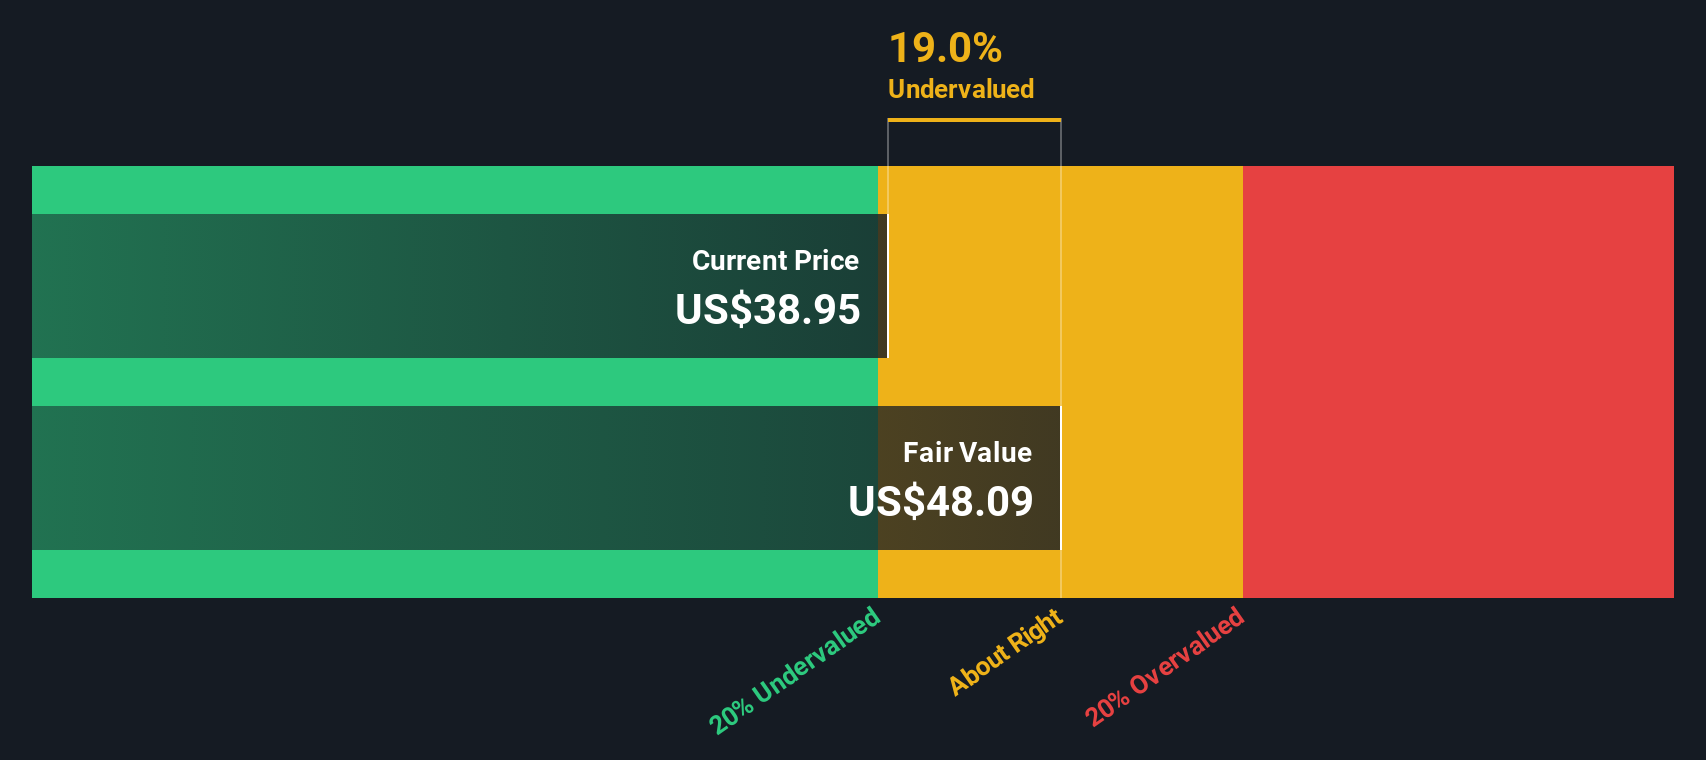
Adding up these discounted cash flows and a terminal value gives an estimated intrinsic value of about $85.58 per share. Compared with the recent share price around $43.12, the DCF output suggests the stock trades at roughly a 49.6% discount to this intrinsic estimate. Under this framework, it screens as materially undervalued.
Result: UNDERVALUED
Our Discounted Cash Flow (DCF) analysis suggests PotlatchDeltic is undervalued by 49.6%. Track this in your watchlist or portfolio, or discover 877 more undervalued stocks based on cash flows.
Approach 2: PotlatchDeltic Price vs Earnings
For a company that is generating earnings, the P/E ratio is a straightforward way to see how much investors are paying for each dollar of profit. It gives you a quick sense of how the market is weighing the business today relative to its current earnings power.
What counts as a “normal” P/E depends a lot on expectations and risk. Higher expected earnings growth or more resilient cash flows usually support a higher multiple. In contrast, higher uncertainty or weaker profitability tend to pull it down.
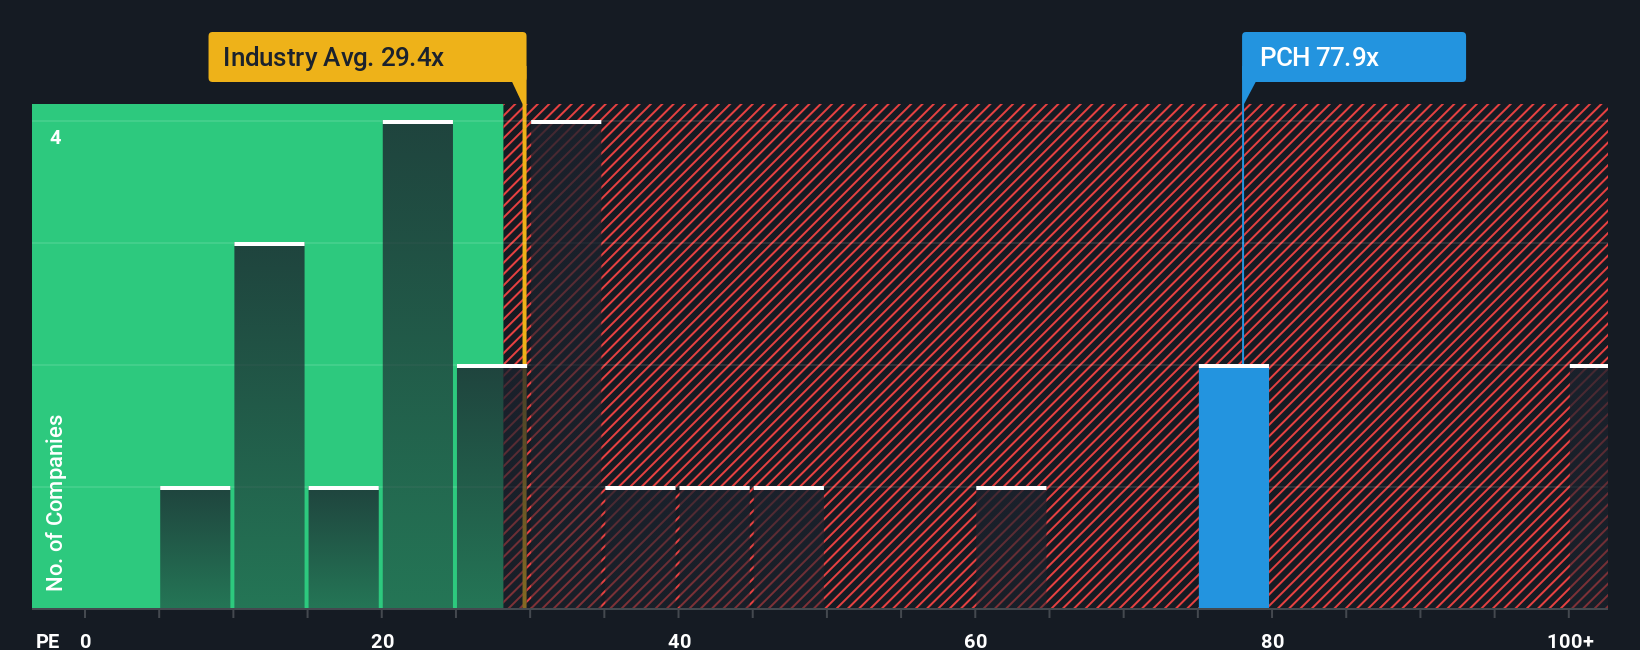
PotlatchDeltic is trading on a P/E of 51.88x. That compares with an industry average P/E for Specialized REITs of 16.61x and a peer group average of 34.80x, so the stock changes hands at a higher multiple than both of those simple yardsticks.
Simply Wall St’s Fair Ratio for PotlatchDeltic is 41.67x. This is a proprietary estimate of what the P/E might look like after accounting for factors such as the company’s earnings growth profile, profit margins, industry, market cap and risk characteristics. Because it folds these elements into a single number, the Fair Ratio can offer a more tailored reference point than a broad peer or industry comparison.
Comparing the current P/E of 51.88x with the Fair Ratio of 41.67x suggests the shares are trading above that custom benchmark.
Result: OVERVALUED
P/E ratios tell one story, but what if the real opportunity lies elsewhere? Discover 1442 companies where insiders are betting big on explosive growth.
Upgrade Your Decision Making: Choose your PotlatchDeltic Narrative
Earlier we mentioned that there is an even better way to understand valuation. Narratives let you attach a clear story to your numbers by connecting your view of PotlatchDeltic's future revenue, earnings and margins to a forecast and then to your own fair value, all within Simply Wall St's Community page that is used by millions of investors. You can, for example, side with a more optimistic view that sees future merger synergies, higher margin climate related opportunities and a fair value around US$50.63, or a more cautious view that leans closer to the current analyst fair value of about US$47.50. You can then compare any of those fair values with the current share price and have that Narrative update automatically as fresh news or earnings on PotlatchDeltic and its planned Rayonier merger are added.
Do you think there's more to the story for PotlatchDeltic? Head over to our Community to see what others are saying!

This article by Simply Wall St is general in nature. We provide commentary based on historical data and analyst forecasts only using an unbiased methodology and our articles are not intended to be financial advice. It does not constitute a recommendation to buy or sell any stock, and does not take account of your objectives, or your financial situation. We aim to bring you long-term focused analysis driven by fundamental data. Note that our analysis may not factor in the latest price-sensitive company announcements or qualitative material. Simply Wall St has no position in any stocks mentioned.
Have feedback on this article? Concerned about the content? Get in touch with us directly. Alternatively, email editorial-team@simplywallst.com